

Note
Go to the end to download the full example code or to run this example in your browser via Binder.
plotting model data#
One strength of ogstools is to simplify the process of plotting mesh data.
For 2D meshes (or slices of 3D meshes) we use the matplotlib backend, as it
is able to generate paper-quality and highly customizable figures.
For 3D meshes we use the pyvista backend, as it is better suited for this task.
Here we show basic usage. More advanced usage can be found in the examples
We use Variables to specify which data to plot,
(Variable presets and data transformation)
but strings as an argument work equally well.
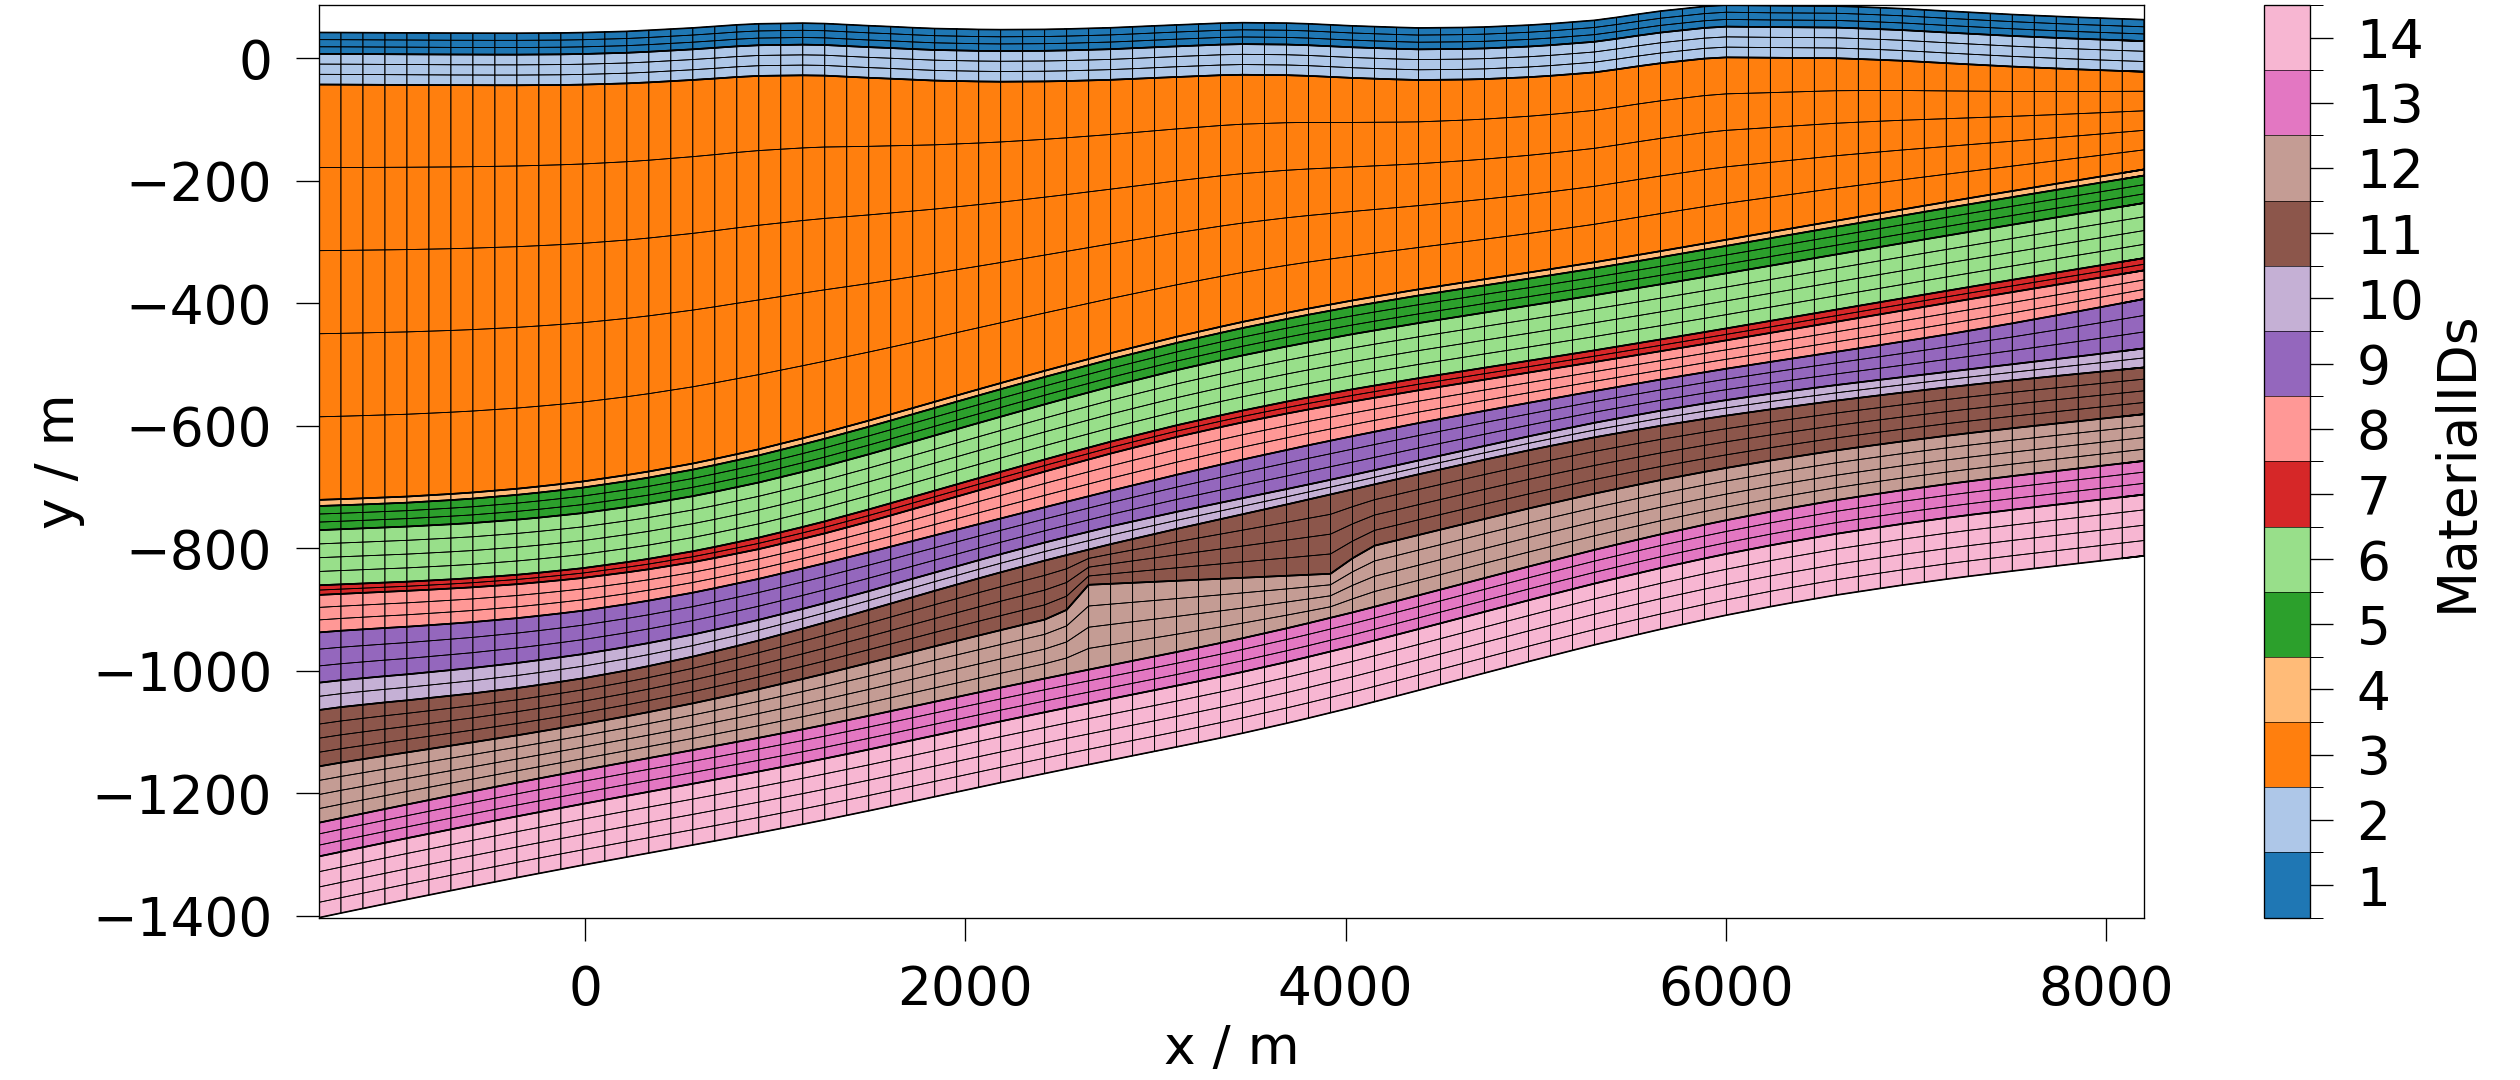
Plotting filled 2D contours returns a matplotlib figure. Via fig.axes
you have access to the Axes object and can further customize and plot to
your liking.
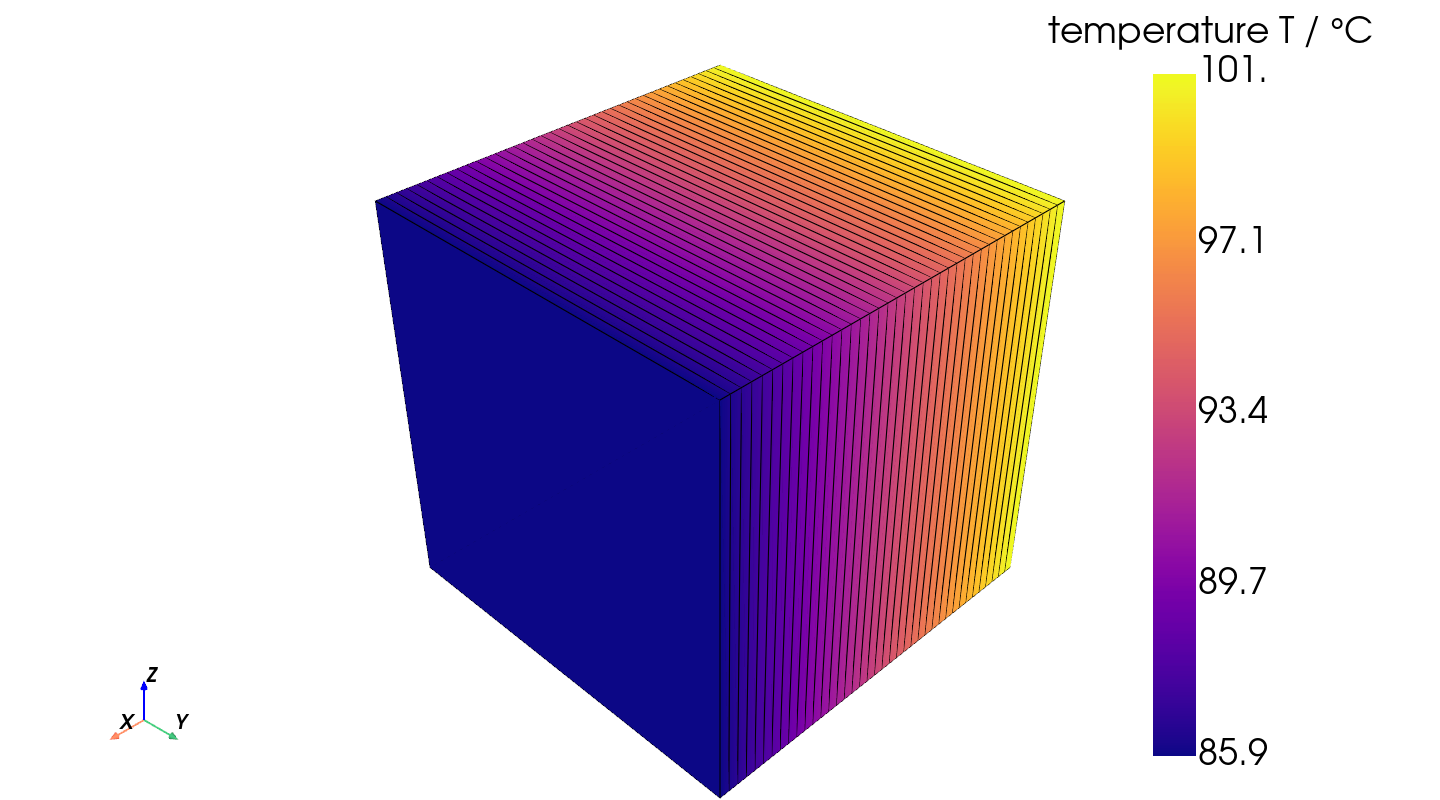
Plotting 3D meshes returns a pyvista.Plotter object, which you can add
other meshes to or change some visualization parameters. Note: In the
interactive scene the colorbar labels may be faulty until you start moving the
model around.
plotter = ot.plot.contourf(mesh_3D, ot.variables.temperature)
plotter.show()
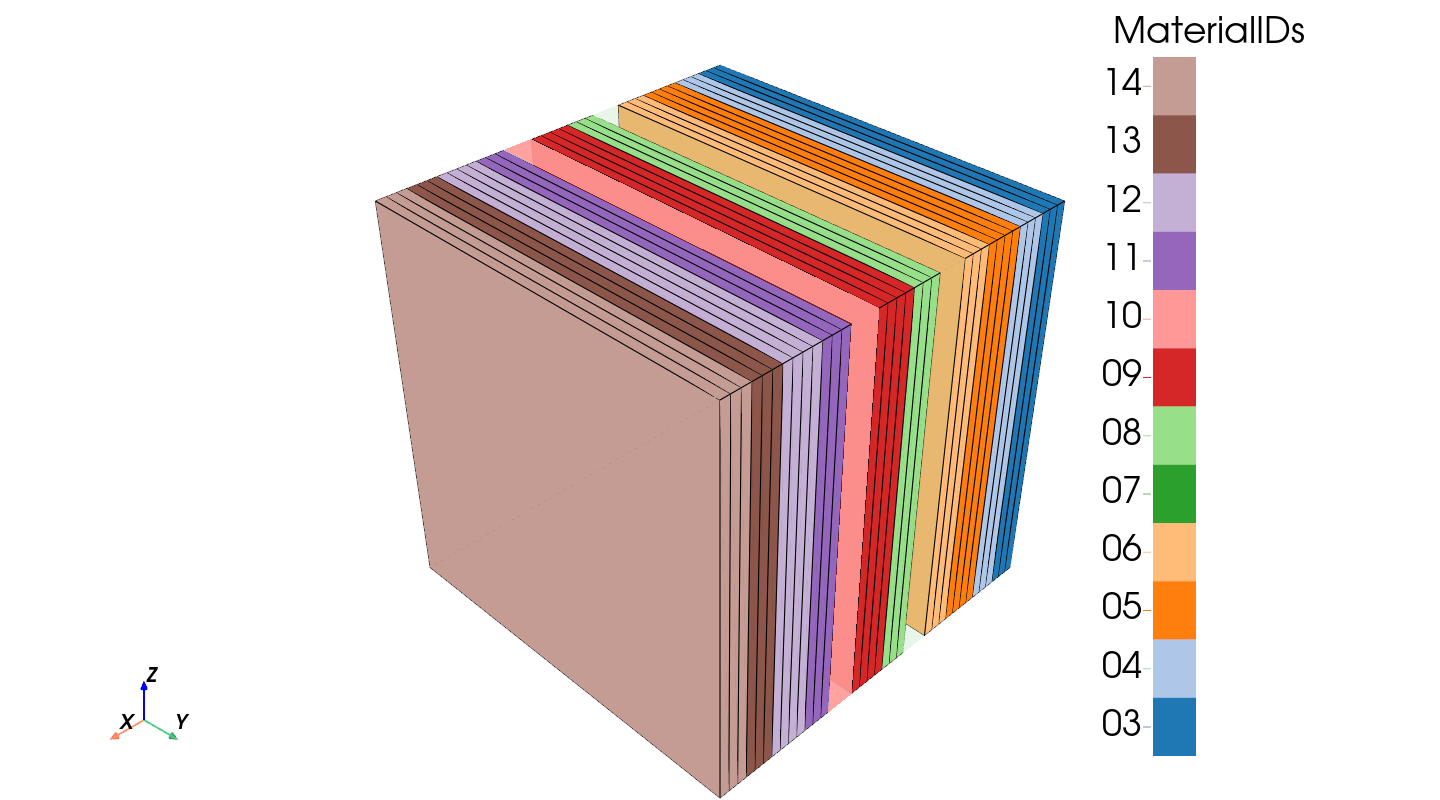
Plotting cell data also works. In this case we plot categorical material ids
and have some of them labeled. You can also add a dictionary to map
transparencies to the individual ids. Passing interactive=false will
return a screenshot instead of a Plotter.
adding a synthetic MaterialIDs field for demonstration purposes
cpts = mesh_3D.cell_centers().points
mesh_3D.cell_data["MaterialIDs"] = (12 * cpts[:, 0] + 3).astype(int)
ot.plot.contourf(mesh_3D,
    "MaterialIDs", opacities={7: 0.1, 10: 0.9}, interactive=False
)
# You have to be aware, if you switch between local and remote rendering in your
# notebook, that there are some differences in the resulting figure. E.g. remote
# rendering seems to have trouble correctly labeling categorical values.
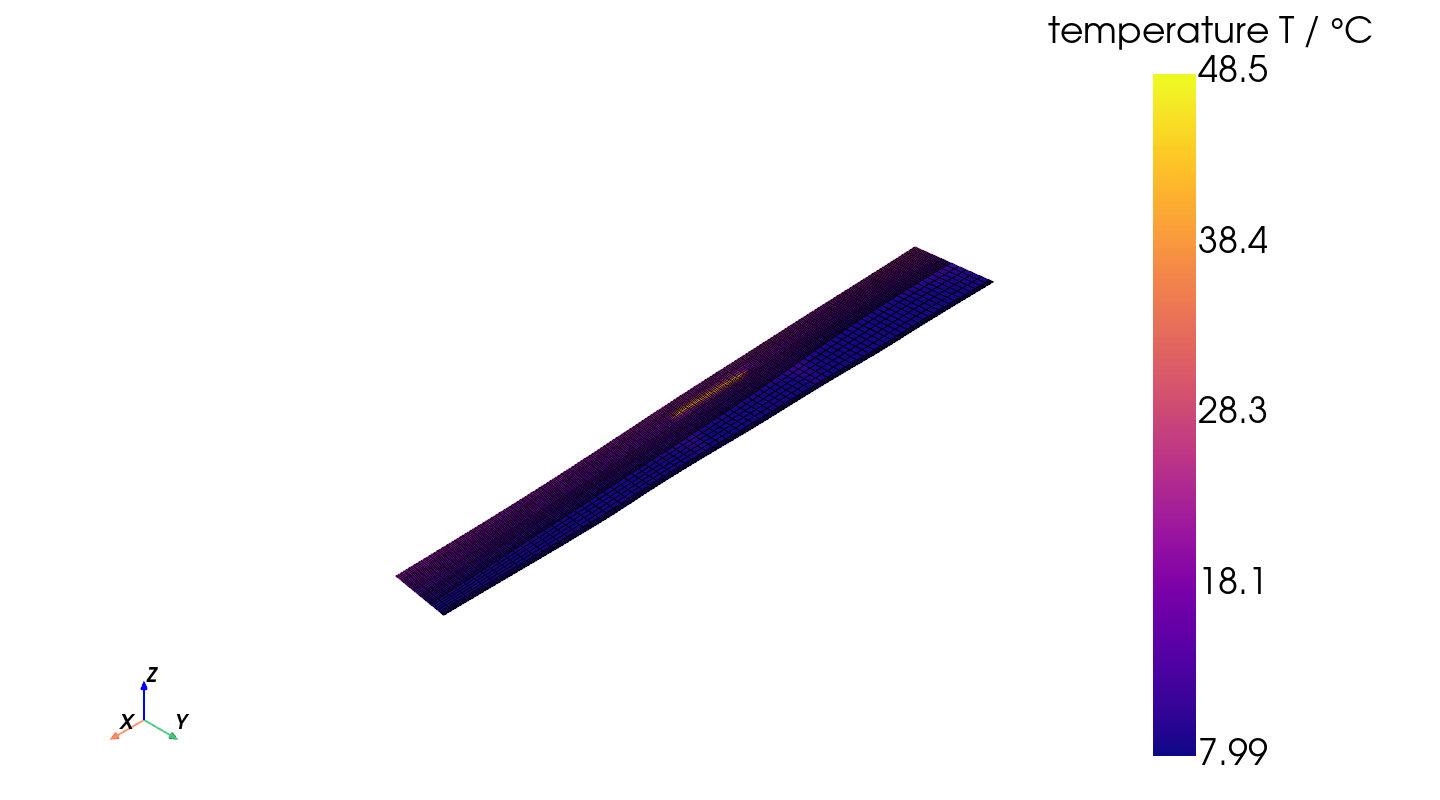
When passing interactive=true, also 2D meshes will use the pyvista
backend:
plotter = ot.plot.contourf(mesh_2D, ot.variables.temperature, interactive=True)
plotter.show()
Total running time of the script: (0 minutes 2.071 seconds)