Note
Go to the end to download the full example code
Features of propertylib#
Section author: Florian Zill (Helmholtz Centre for Environmental Research GmbH - UFZ)
propertylib provides a common interface for other modules to structure
reading, conversion and output of mesh data.
import matplotlib.pyplot as plt
import numpy as np
import pandas as pd

from ogstools.propertylib import presets
There are some predefined default properties:
tab = pd.DataFrame(presets.all_properties).set_index("output_name")
tab["type"] = [p.type_name for p in presets.all_properties]
tab.drop(["func", "bilinear_cmap"], axis=1).sort_values(["mask", "data_name"])
You can access properties either form the entire collection or from a subset which only contains properties available to a specific OGS process. Calling a property converts the argument from data_unit to output_unit and applies a function if specified.
print(presets.temperature(273.15))  # access from the entire collection
print(presets.strain(0.01))  # access from Mechanics collection
0 °C
1 %
VectorProperties and MatrixProperties contain other Properties which represent the result of an applied function on itself. Components can be accessed with brackets. VectorProperties should be of length 2 or 3 corresponding to the dimension. MatrixProperties likewise should be of length 4 [xx, yy, zz, xy] or 6 [xx, yy, zz, xy, yz, xz].
Element 1 (counting from 0) of a 3D displacement vector:
print(presets.displacement[1]([0.01, 0.02, 0.03]))
0.02 m
Magnitude of a 2D displacement vector from:
print(presets.displacement.magnitude([0.03, 0.04]))
0.05 m
Log of Magnitude of a 2D velocity vector from the Hydraulics collection:
print(presets.velocity.log_magnitude(np.sqrt([50, 50])))
1
Magnitude and trace of a 3D strain matrix:
eps = np.array([1, 3, 9, 1, 2, 2]) * 1e-2
print(presets.strain.magnitude(eps))
print(presets.strain.trace(eps))
10 %
13 %
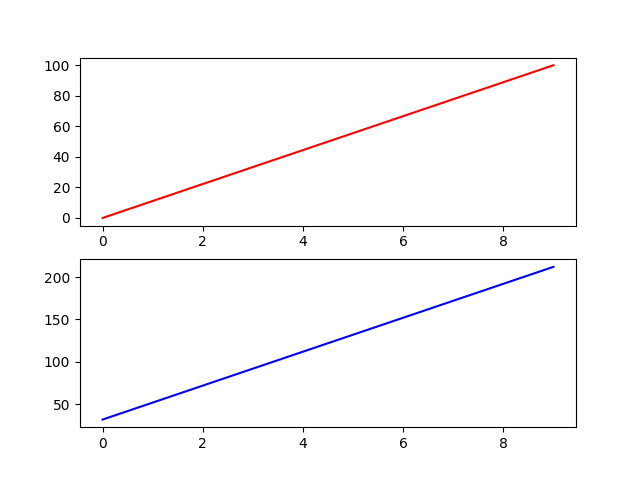
You can change the attributes of the defaults. For example for temperature from the Thermal Collection from the default output_unit °C to °F:
temp = np.linspace(273.15, 373.15, 10)
fig, axs = plt.subplots(2)
axs[0].plot(presets.temperature(temp), color="r")
temperature_F = presets.temperature.replace(output_unit="°F")
axs[1].plot(temperature_F(temp), color="b")
fig.show()

/workspaces/tools/.venv-devcontainer/lib/python3.9/site-packages/matplotlib/cbook/__init__.py:1345: UnitStrippedWarning: The unit of the quantity is stripped when downcasting to ndarray.
  return np.asarray(x, float)
Total running time of the script: (0 minutes 0.081 seconds)