Note
Go to the end to download the full example code
How to convert a FEFLOW model and simulate it in OGS.#
Section author: Julian Heinze (Helmholtz Centre for Environmental Research GmbH - UFZ)
In this example we show how a simple FEFLOW model can be converted to a pyvista.UnstructuredGrid and then be simulated in OGS.
Necessary imports
import tempfile
import xml.etree.ElementTree as ET
from pathlib import Path

import ifm_contrib as ifm
import pyvista as pv
from ogs6py import ogs

from ogstools.feflowlib import (
    convert_properties_mesh,
    extract_cell_boundary_conditions,
    setup_prj_file,
    steady_state_diffusion,
)
from ogstools.feflowlib.examples import path_box_Neumann
from ogstools.feflowlib.tools import (
    extract_point_boundary_conditions,
    get_material_properties,
)
Load a FEFLOW model (.fem) as a FEFLOW document and convert it.
feflow_model = ifm.loadDocument(path_box_Neumann)
pyvista_mesh = convert_properties_mesh(feflow_model)

pv.global_theme.colorbar_orientation = "vertical"
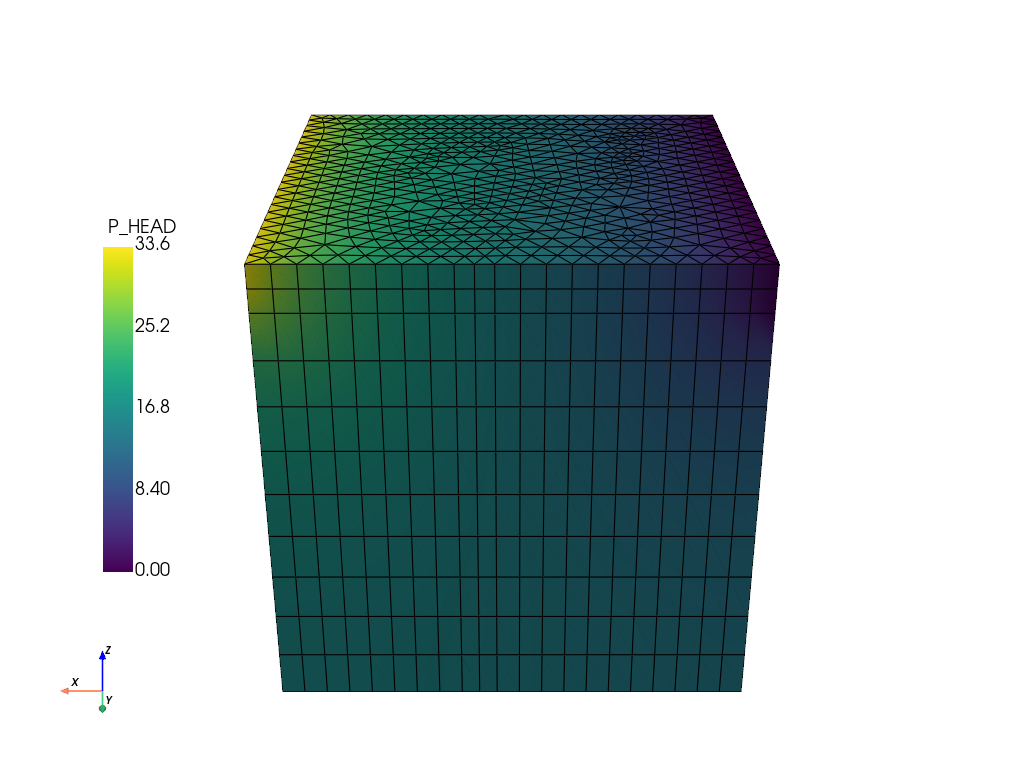
pyvista_mesh.plot(
    show_edges=True,
    off_screen=True,
    scalars="P_HEAD",
    cpos=[0, 1, 0.5],
    scalar_bar_args={"position_x": 0.1, "position_y": 0.25},
)
print(pyvista_mesh)
path_writing = Path(tempfile.mkdtemp("feflow_test_simulation"))
path_mesh = path_writing / "boxNeumann.vtu"
pyvista_mesh.save(str(path_mesh))

UnstructuredGrid (0x7f3112b795a0)
  N Cells:    11462
  N Points:   6768
  X Bounds:   0.000e+00, 1.000e+02
  Y Bounds:   0.000e+00, 1.000e+02
  Z Bounds:   -1.000e+02, 0.000e+00
  N Arrays:   23
Extract the point and cell boundary conditions and write them to a temporary directory.
point_BC_dict = extract_point_boundary_conditions(path_writing, pyvista_mesh)
# Since there can be multiple point boundary conditions on the bulk mesh,
# they are saved and plotted iteratively.
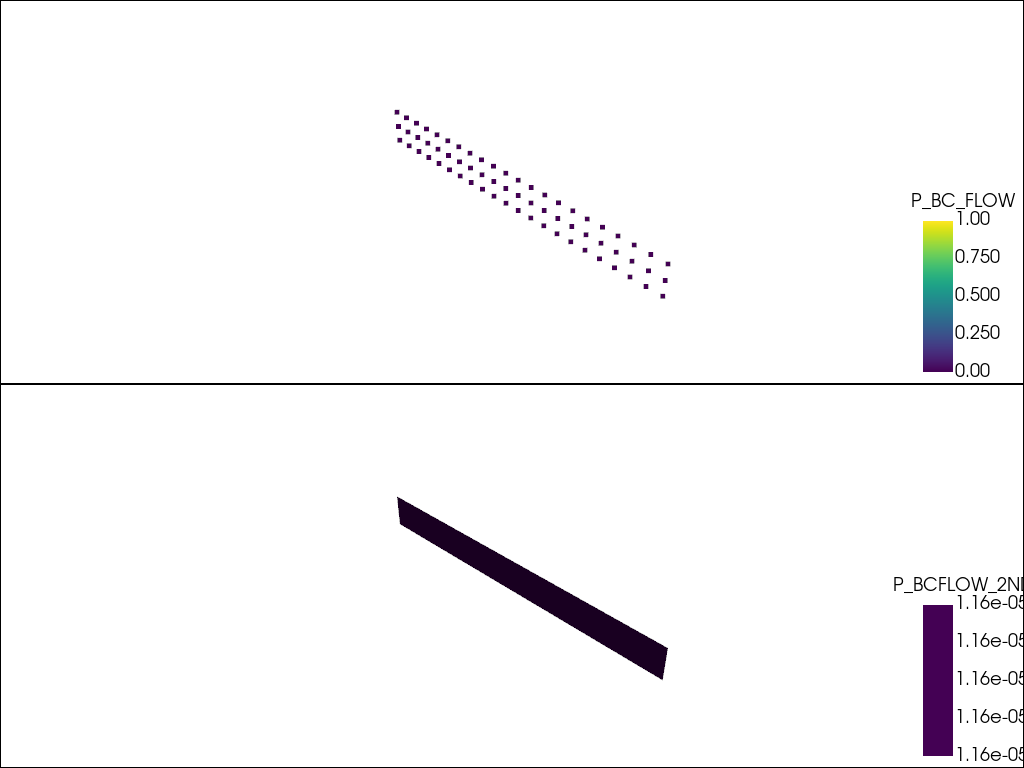
plotter = pv.Plotter(shape=(len(point_BC_dict), 1))
for i, (path, boundary_condition) in enumerate(point_BC_dict.items()):
    boundary_condition.save(path)
    plotter.subplot(i, 0)
    plotter.add_mesh(boundary_condition, scalars=Path(path).stem)
plotter.show()
path_topsurface, topsurface = extract_cell_boundary_conditions(
    path_mesh, pyvista_mesh
)
# On the topsurface can be cell based boundary condition.
# The boundary conditions on the topsurface of the model are required for generalization.
topsurface.save(path_topsurface)

Setup a prj-file to run a OGS-simulation
path_prjfile = str(path_mesh.with_suffix(".prj"))
prjfile = ogs.OGS(PROJECT_FILE=str(path_prjfile))
# Get the template prj-file configurations for a steady state diffusion process
model = steady_state_diffusion(
    path_writing / "sim_boxNeumann",
    prjfile,
)
# Include the mesh specific configurations to the template.
model = setup_prj_file(
    path_mesh,
    pyvista_mesh,
    get_material_properties(pyvista_mesh, "P_CONDX"),
    "steady state diffusion",
    model,
)
# The model must be written before it can be run.
model.write_input(str(path_prjfile))
# Simply print the prj-file as an example.
read_model = ET.parse(str(path_prjfile))
root = read_model.getroot()
ET.dump(root)
<OpenGeoSysProject>
    <meshes>
        <mesh>boxNeumann.vtu</mesh>
        <mesh>topsurface_boxNeumann.vtu</mesh>
        <mesh>P_BC_FLOW.vtu</mesh>
        <mesh>P_BCFLOW_2ND.vtu</mesh>
    </meshes>
    <processes>
        <process>
            <name>SteadyStateDiffusion</name>
            <type>STEADY_STATE_DIFFUSION</type>
            <integration_order>2</integration_order>
            <secondary_variables>
                <secondary_variable internal_name="darcy_velocity" output_name="v" />
            </secondary_variables>
            <process_variables>
                <process_variable>HEAD_OGS</process_variable>
            </process_variables>
        </process>
    </processes>
    <media>
        <medium id="0">
            <properties>
                <property>
                    <name>diffusion</name>
                    <type>Constant</type>
                    <value>1.1574074074074073e-05</value>
                </property>
                <property>
                    <name>reference_temperature</name>
                    <type>Constant</type>
                    <value>293.15</value>
                </property>
            </properties>
        </medium>
    </media>
    <time_loop>
        <processes>
            <process ref="SteadyStateDiffusion">
                <nonlinear_solver>basic_picard</nonlinear_solver>
                <convergence_criterion>
                    <type>DeltaX</type>
                    <norm_type>NORM2</norm_type>
                    <abstol>1e-15</abstol>
                </convergence_criterion>
                <time_discretization>
                    <type>BackwardEuler</type>
                </time_discretization>
                <time_stepping>
                    <type>SingleStep</type>
                </time_stepping>
            </process>
        </processes>
        <output>
            <type>VTK</type>
            <prefix>/tmp/tmp7hvxbazkfeflow_test_simulation/sim_boxNeumann</prefix>
            <timesteps>
                <pair>
                    <repeat>1</repeat>
                    <each_steps>1</each_steps>
                </pair>
            </timesteps>
            <variables />
        </output>
    </time_loop>
    <parameters>
        <parameter>
            <name>p0</name>
            <type>Constant</type>
            <value>0</value>
        </parameter>
        <parameter>
            <name>P_BC_FLOW</name>
            <type>MeshNode</type>
            <mesh>P_BC_FLOW</mesh>
            <field_name>P_BC_FLOW</field_name>
        </parameter>
        <parameter>
            <name>P_BCFLOW_2ND</name>
            <type>MeshNode</type>
            <mesh>P_BCFLOW_2ND</mesh>
            <field_name>P_BCFLOW_2ND</field_name>
        </parameter>
    </parameters>
    <process_variables>
        <process_variable>
            <name>HEAD_OGS</name>
            <components>1</components>
            <order>1</order>
            <initial_condition>p0</initial_condition>
            <boundary_conditions>
                <boundary_condition>
                    <type>Dirichlet</type>
                    <mesh>P_BC_FLOW</mesh>
                    <parameter>P_BC_FLOW</parameter>
                </boundary_condition>
                <boundary_condition>
                    <type>Neumann</type>
                    <mesh>P_BCFLOW_2ND</mesh>
                    <parameter>P_BCFLOW_2ND</parameter>
                </boundary_condition>
            </boundary_conditions>
        </process_variable>
    </process_variables>
    <nonlinear_solvers>
        <nonlinear_solver>
            <name>basic_picard</name>
            <type>Picard</type>
            <max_iter>10</max_iter>
            <linear_solver>general_linear_solver</linear_solver>
        </nonlinear_solver>
    </nonlinear_solvers>
    <linear_solvers>
        <linear_solver>
            <name>general_linear_solver</name>
            <lis>-i cg -p jacobi -tol 1e-6 -maxiter 100000</lis>
            <eigen>
                <solver_type>CG</solver_type>
                <precon_type>DIAGONAL</precon_type>
                <max_iteration_step>100000</max_iteration_step>
                <error_tolerance>1e-6</error_tolerance>
            </eigen>
            <petsc>
                <prefix>sd</prefix>
                <parameters>-sd_ksp_type cg  -sd_pc_type bjacobi -sd_ksp_rtol 1e-16 -sd_ksp_max_it 10000</parameters>
            </petsc>
        </linear_solver>
    </linear_solvers>
</OpenGeoSysProject>
Run the model
model.run_model(logfile=str(path_writing / "out.log"))
OGS finished with project file /tmp/tmp7hvxbazkfeflow_test_simulation/boxNeumann.prj.
Execution took 0.3838622570037842 s
Read the results and plot them.
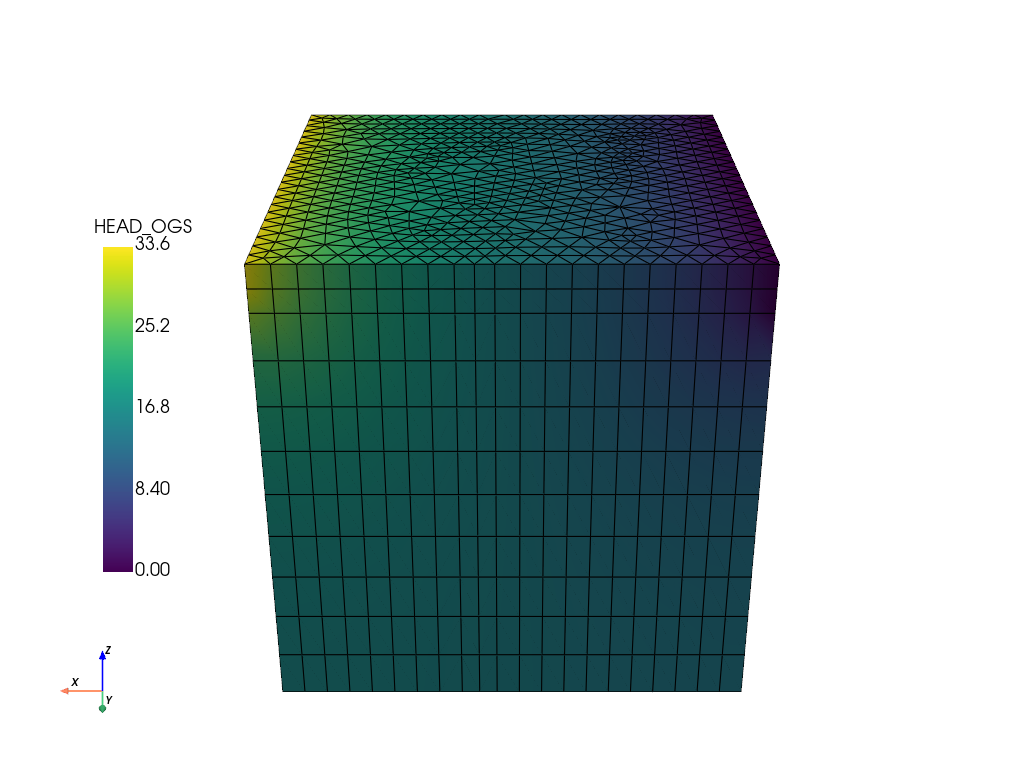
ogs_sim_res = pv.read(str(path_writing / "sim_boxNeumann_ts_1_t_1.000000.vtu"))
ogs_sim_res.plot(
    show_edges=True,
    off_screen=True,
    scalars="HEAD_OGS",
    cpos=[0, 1, 0.5],
    scalar_bar_args={"position_x": 0.1, "position_y": 0.25},
)

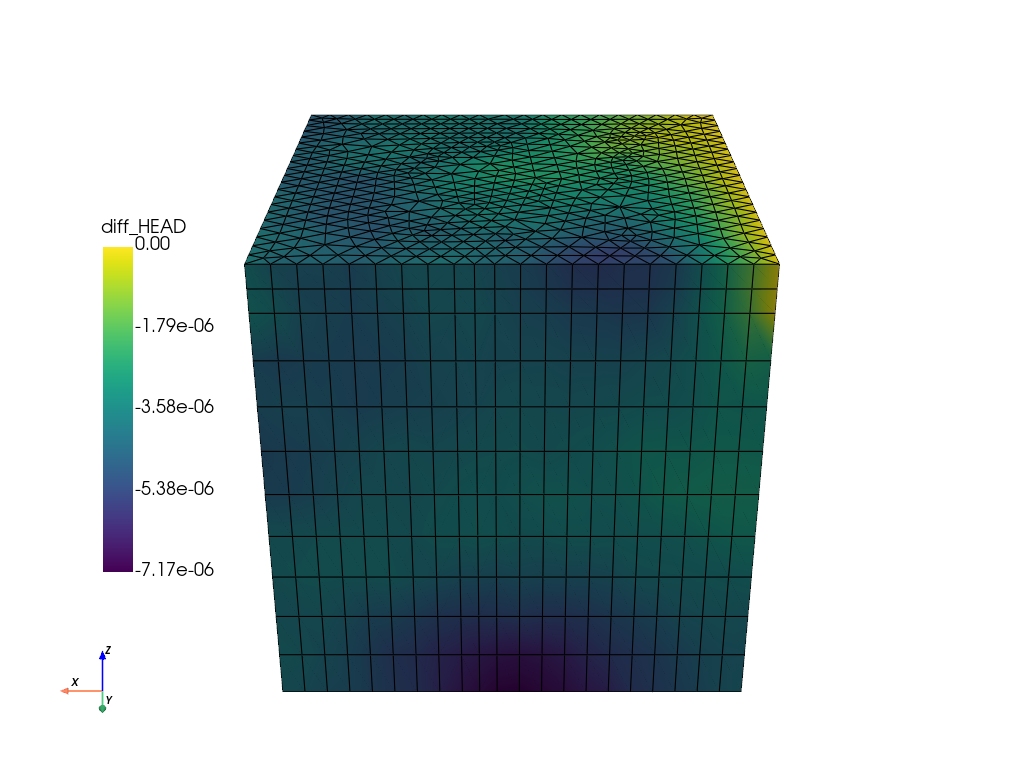
Calculate the difference to the FEFLOW simulation and plot it.
diff = pyvista_mesh["P_HEAD"] - ogs_sim_res["HEAD_OGS"]
pyvista_mesh["diff_HEAD"] = diff
pyvista_mesh.plot(
    show_edges=True,
    off_screen=True,
    scalars="diff_HEAD",
    cpos=[0, 1, 0.5],
    scalar_bar_args={"position_x": 0.1, "position_y": 0.25},
)

Total running time of the script: (0 minutes 2.044 seconds)
