Note
Go to the end to download the full example code
Aspect ratios#
Section author: Florian Zill (Helmholtz Centre for Environmental Research GmbH - UFZ)
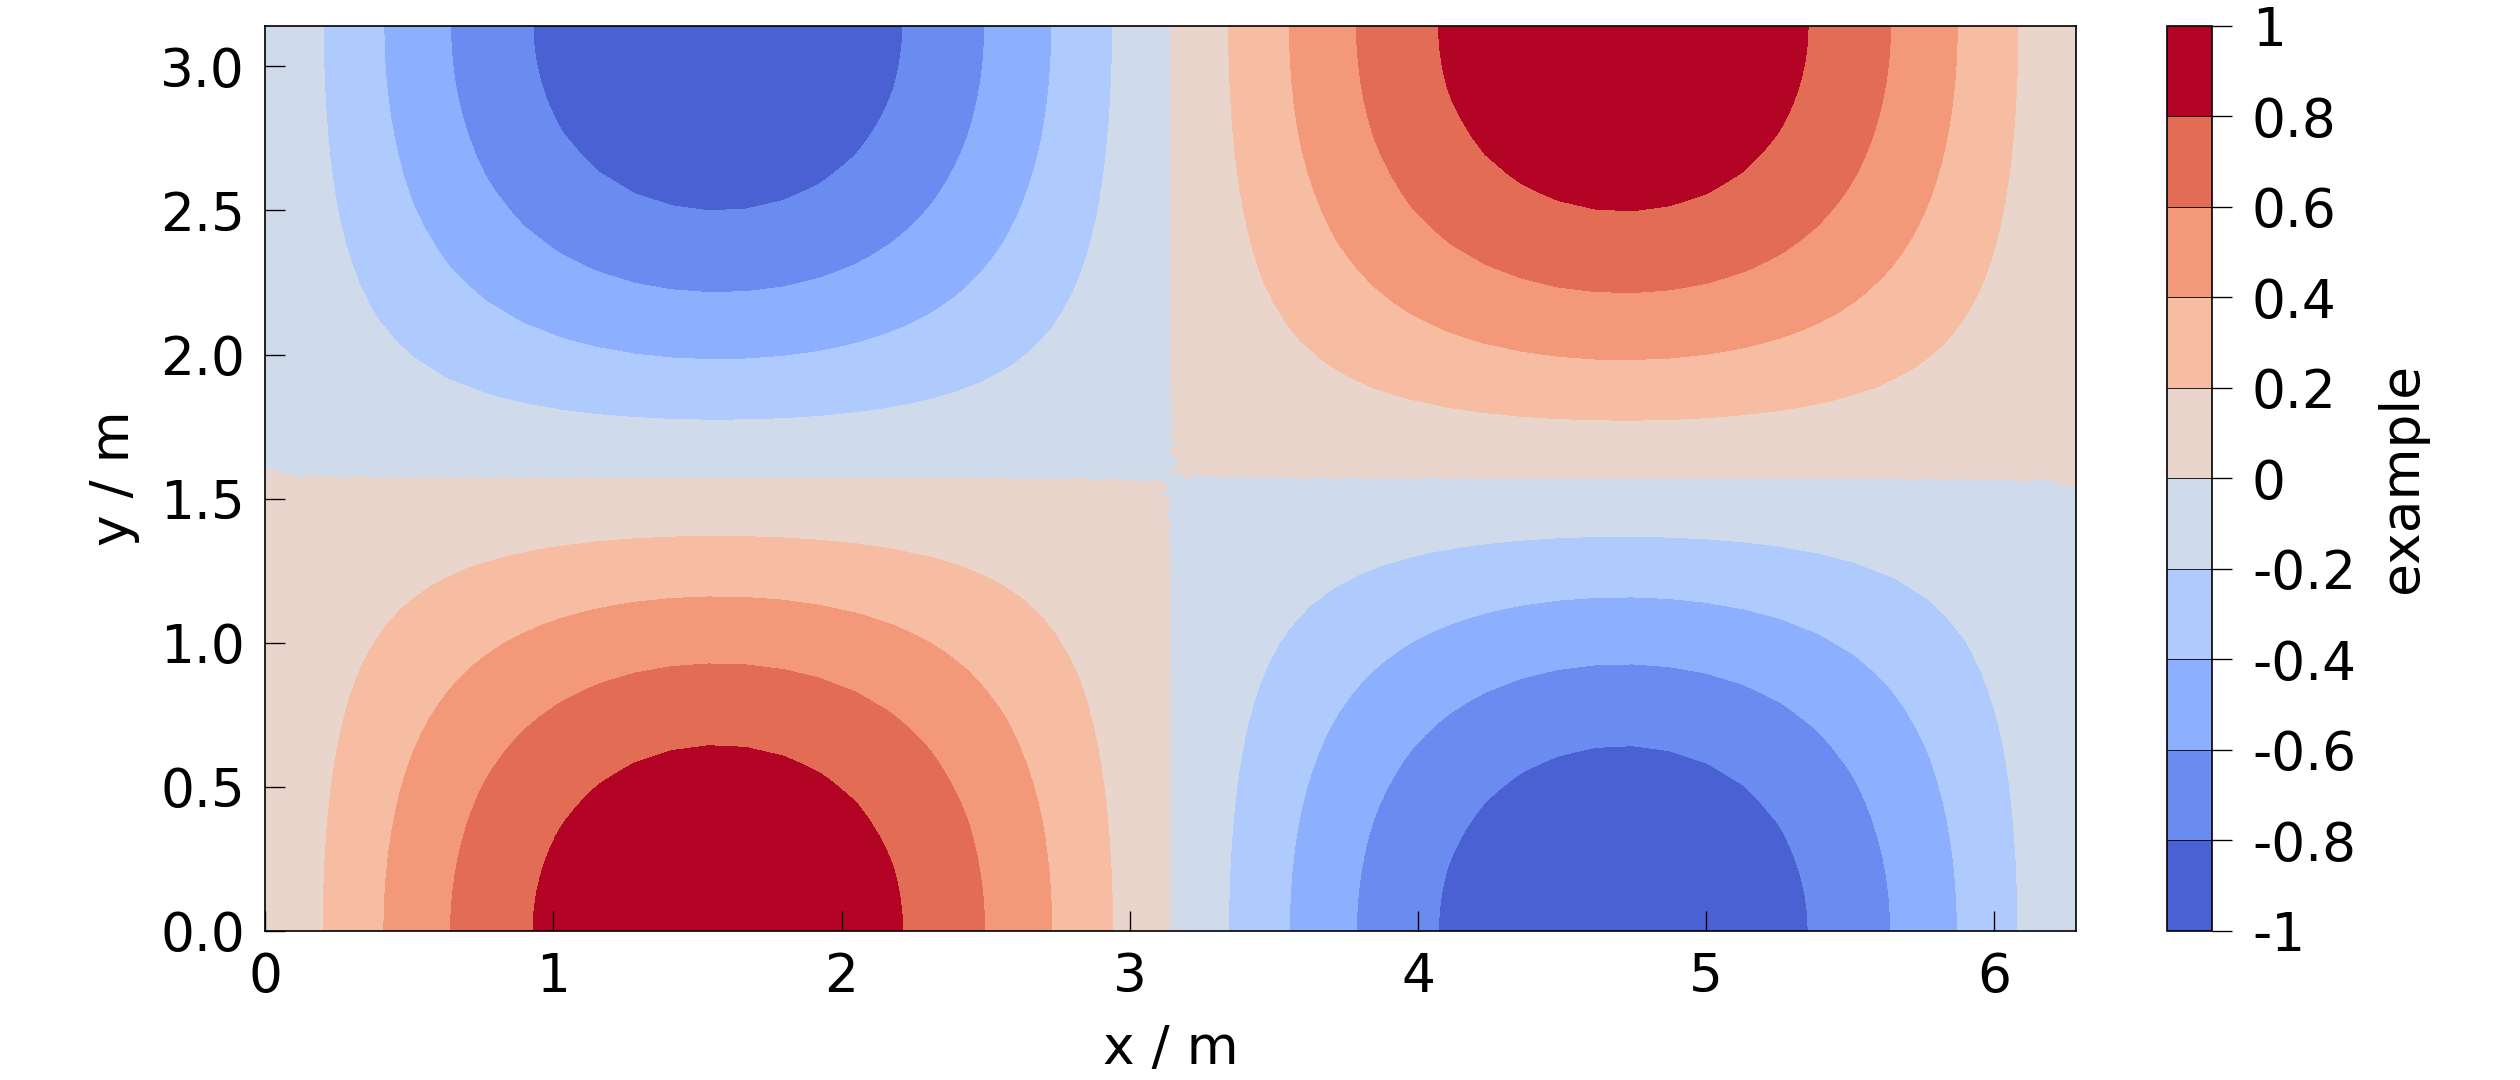
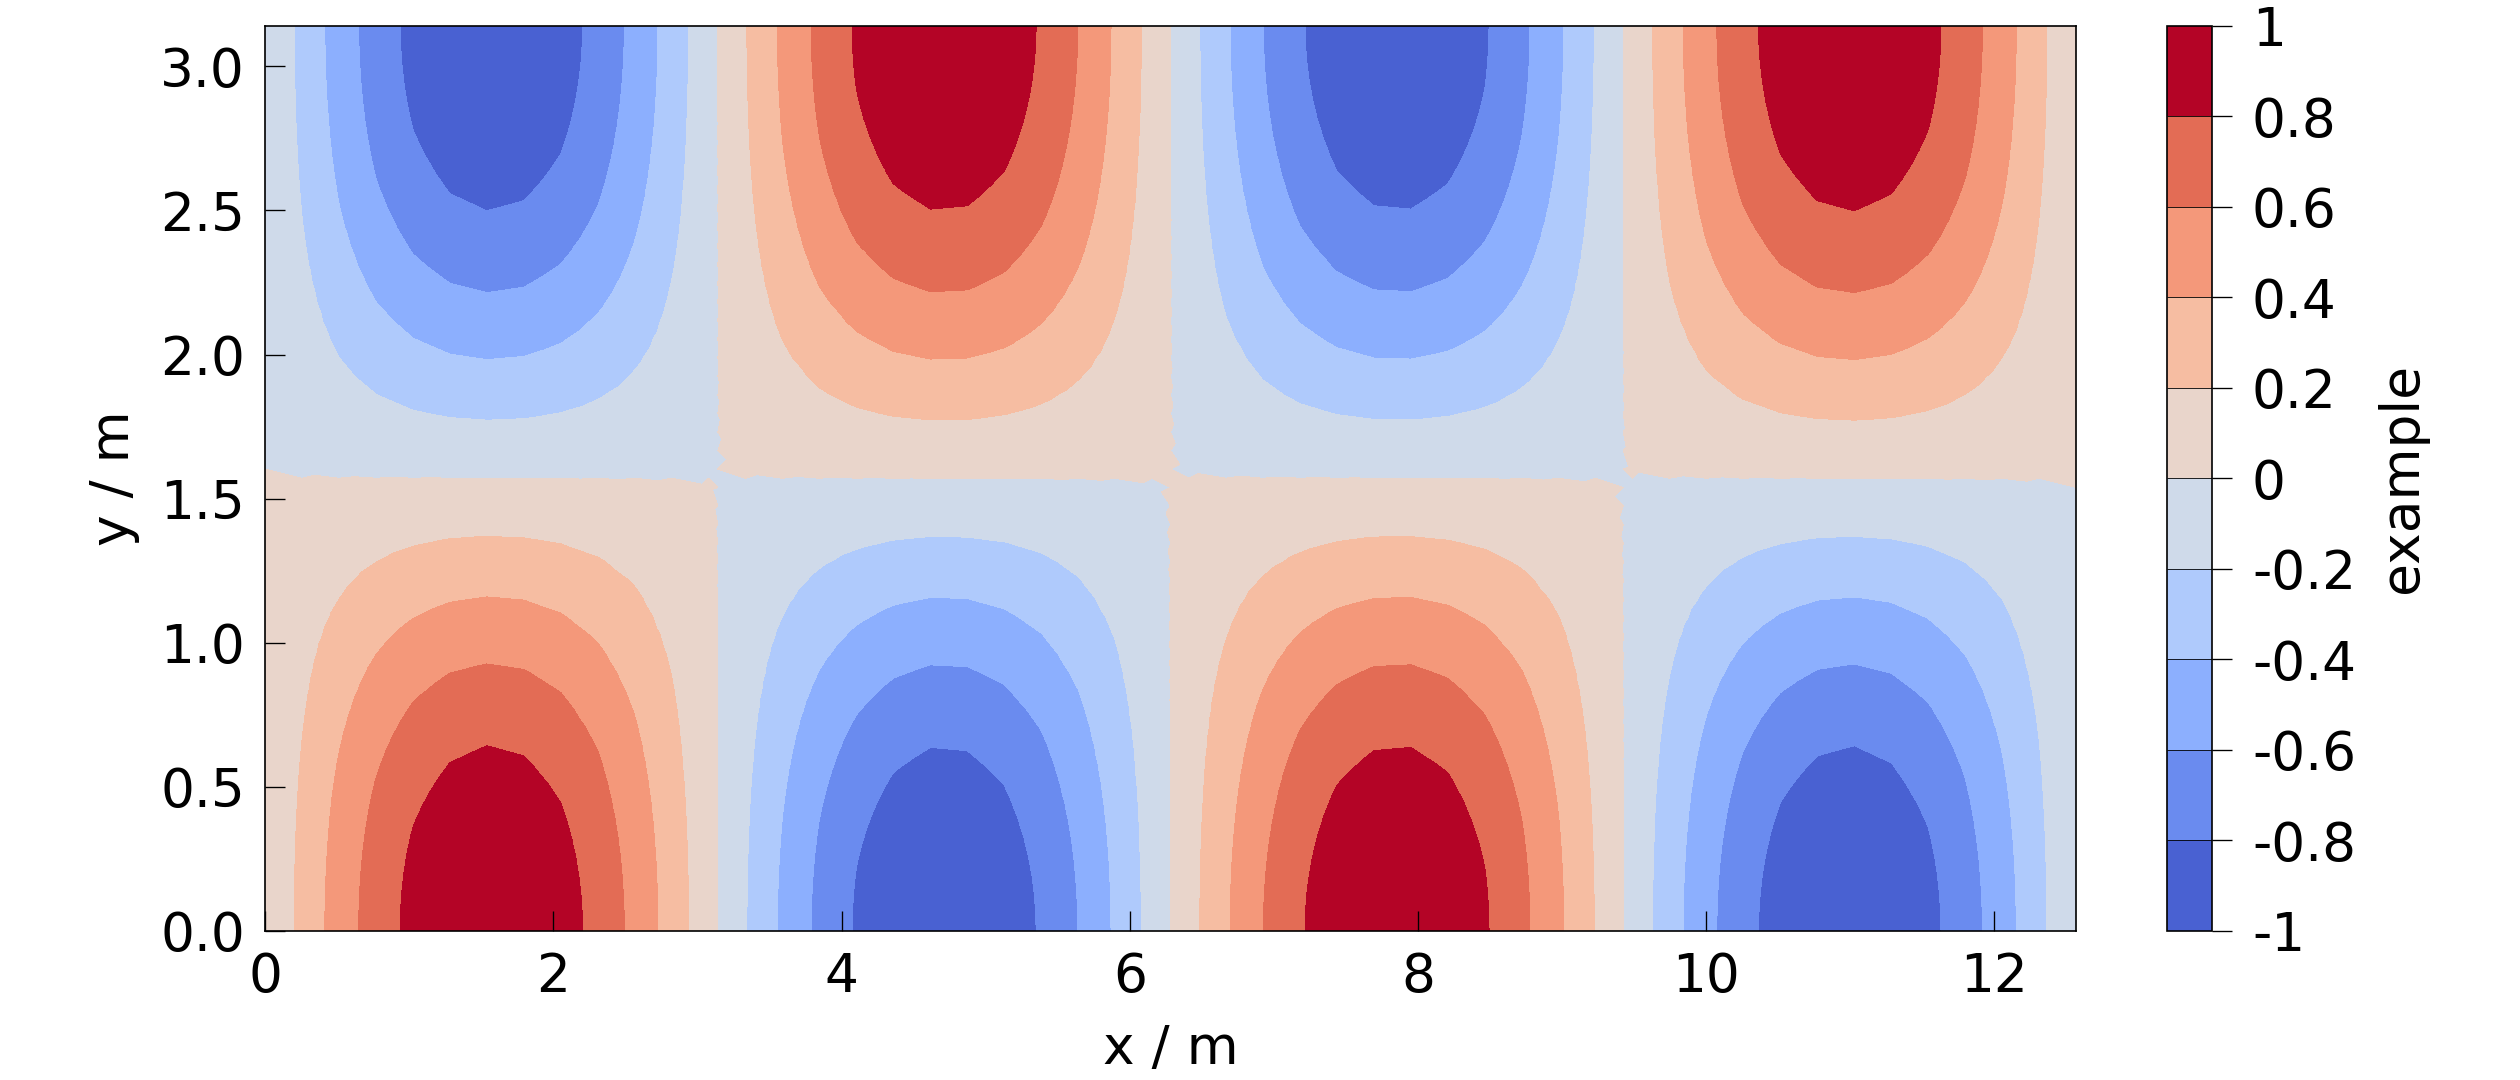
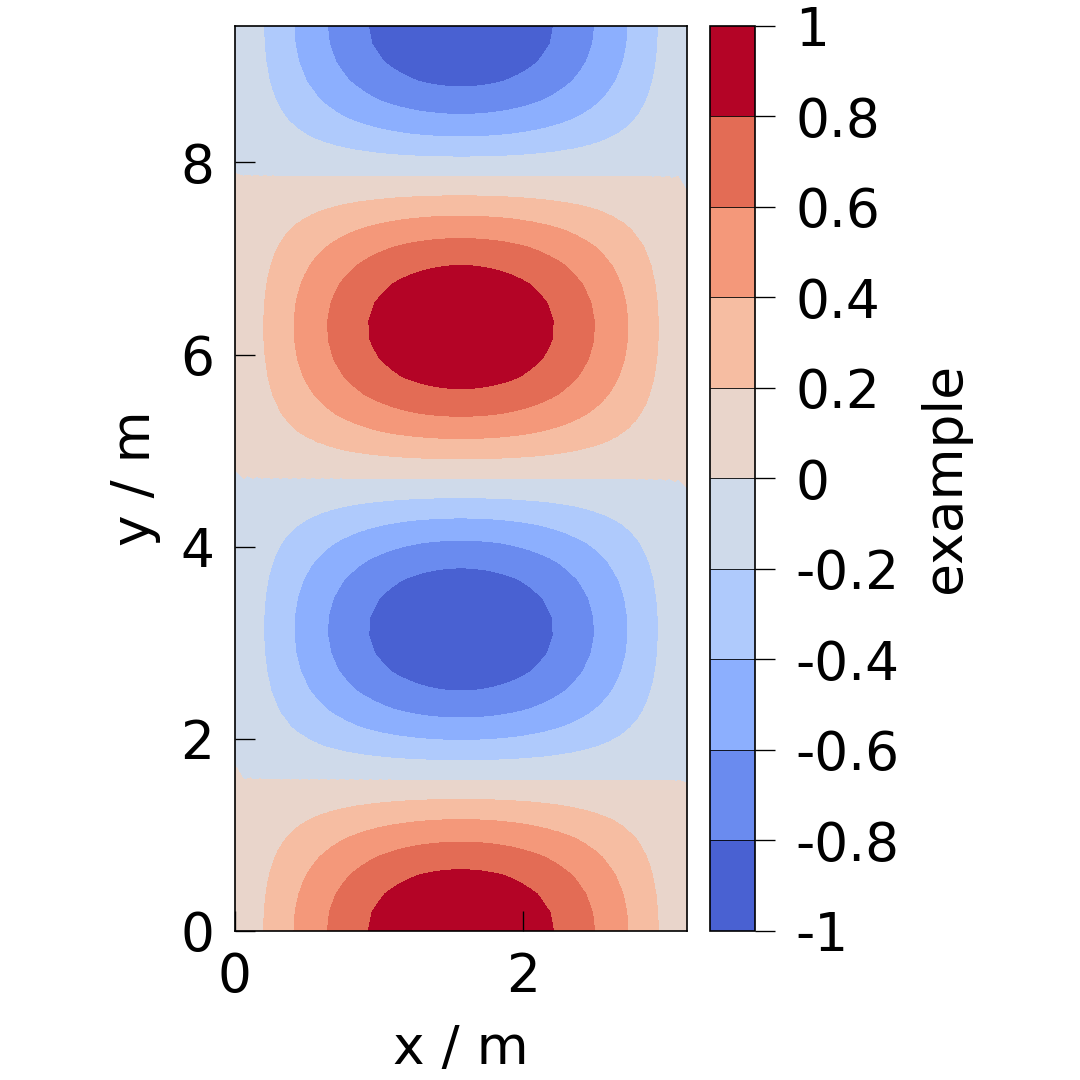
By default plots with meshplotlib try to retain the true mesh proportions. If the meshes aspect ratio lies outside of predefined limits (setup.min_ax_aspect, setup.max_ax_aspect) the axes get compressed to stay inside the given limits. The following examples shall illustrate this behaviour.
import numpy as np
import pyvista as pv

from ogstools.meshplotlib import plot, setup

setup.reset()
print(f"{setup.min_ax_aspect=}")
print(f"{setup.max_ax_aspect=}")
setup.min_ax_aspect=0.5
setup.max_ax_aspect=2.0
The following fits inside the defined limits and gets displayed with true proportions.
fig = plot(custom_mesh(np.pi * 2, np.pi), "example")
This one would be too wide and thus and gets compressed to fit the maximum aspect ratio.
fig = plot(custom_mesh(np.pi * 4, np.pi), "example")
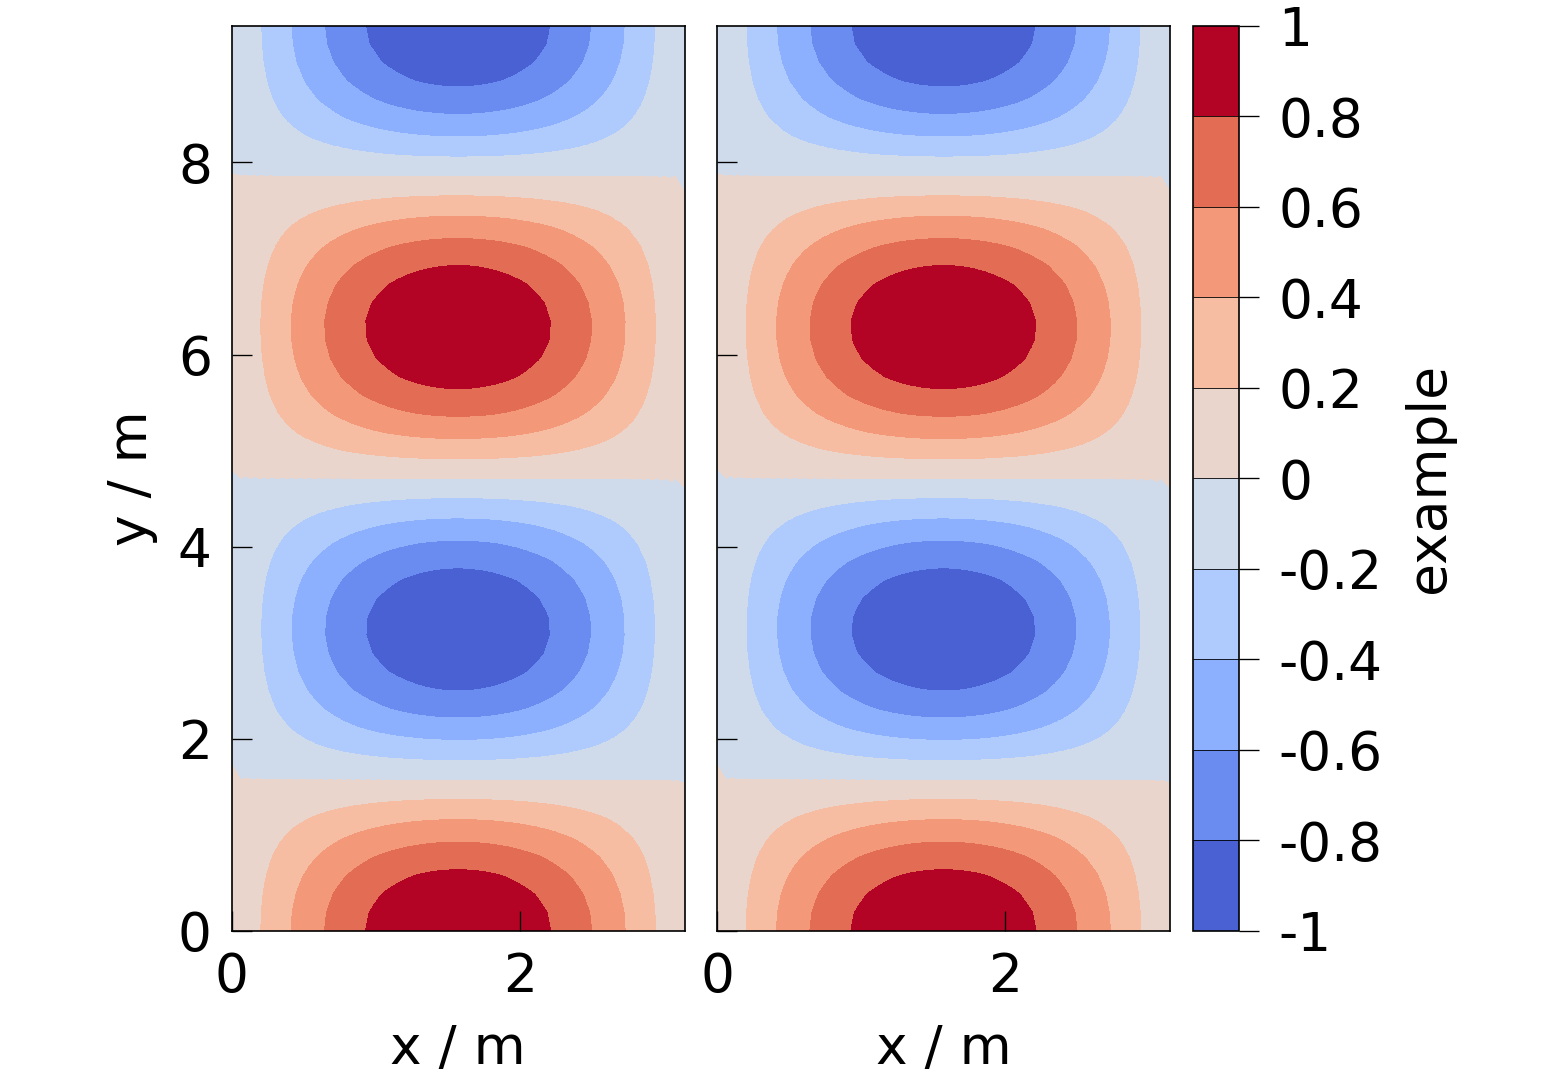
When plotting multiple meshes together, this applies to each subplot. So here each subplot has true proportions again since each one fits the limits.
fig = plot(
    [custom_mesh(np.pi * 2, np.pi), custom_mesh(np.pi * 2, np.pi)], "example"
)

The following figure would be to tall and is clipped to the minimum aspect ratio.
fig = plot(custom_mesh(np.pi, np.pi * 3), "example")
The same is true here:
fig = plot(
    [custom_mesh(np.pi, np.pi * 3), custom_mesh(np.pi, np.pi * 3)], "example"
)
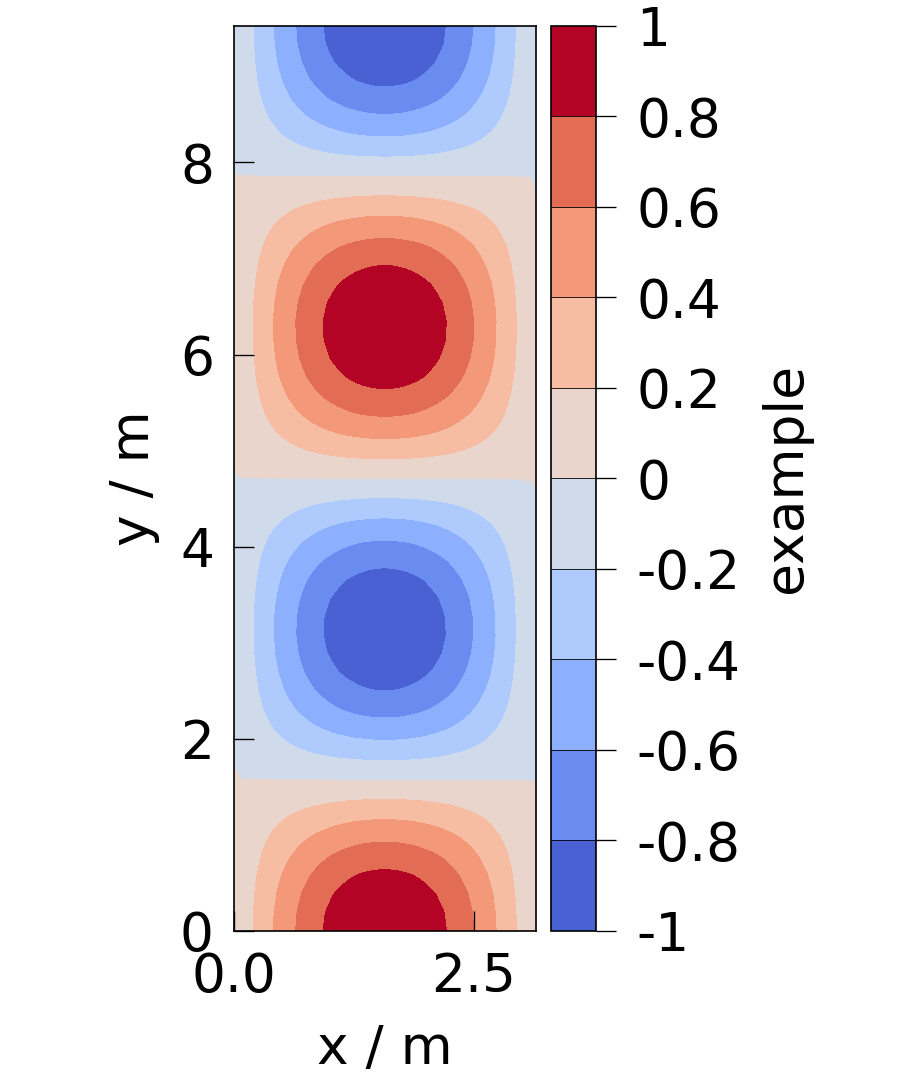
You can enforce true proportions regardless of the resulting figures dimensions, by setting the limiting values to None. In this case we get a very wide figure.
setup.min_ax_aspect = None
setup.max_ax_aspect = None
fig = plot(custom_mesh(np.pi * 3, np.pi), "example")

And in this case we get a very tall figure.
fig = plot(custom_mesh(np.pi, np.pi * 3), "example")
Total running time of the script: (0 minutes 2.604 seconds)
