Note
Go to the end to download the full example code.
Stress analysis#
Section author: Florian Zill (Helmholtz Centre for Environmental Research GmbH - UFZ)
The following example from the ogs benchmark collection is used for the stress analysis:
<https://www.opengeosys.org/docs/benchmarks/thermo-mechanics/creepafterexcavation/>
import ogstools as ot
from ogstools import examples
from ogstools.meshplotlib import plot, setup
from ogstools.meshplotlib.plot_features import plot_streamlines
from ogstools.propertylib import mesh_dependent, properties

setup.reset()
setup.length.output_unit = "km"
mesh = examples.load_mesh_mechanics_2D()
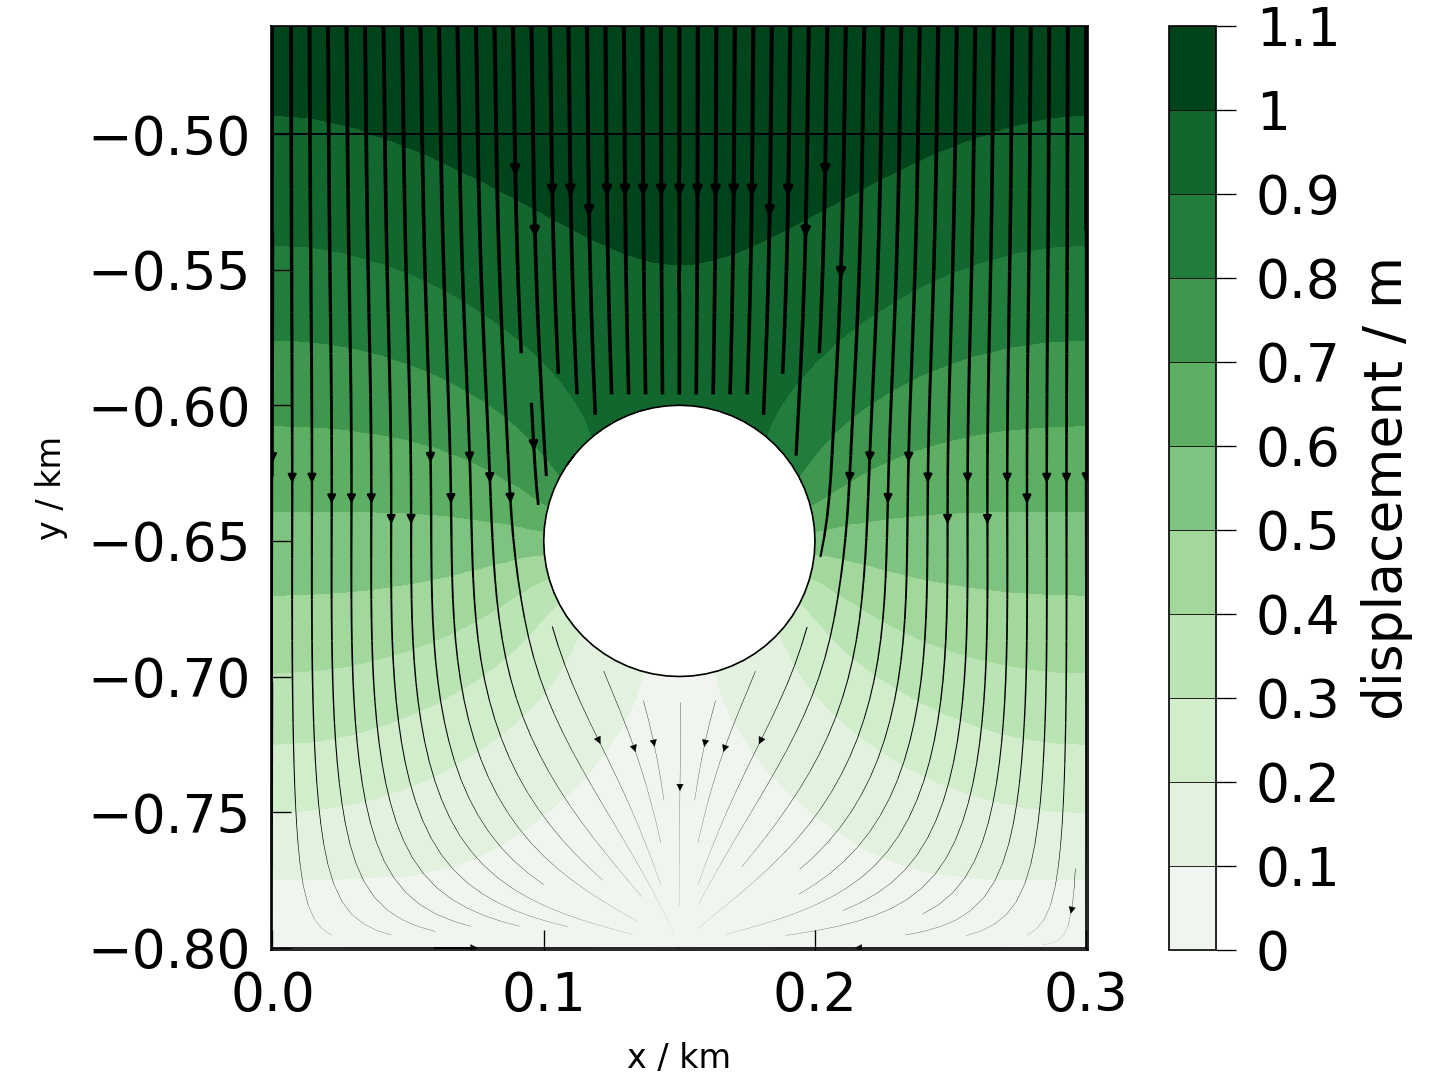
mesh_property = ot.properties.displacement
fig = plot(mesh, mesh_property)
Tensor components#
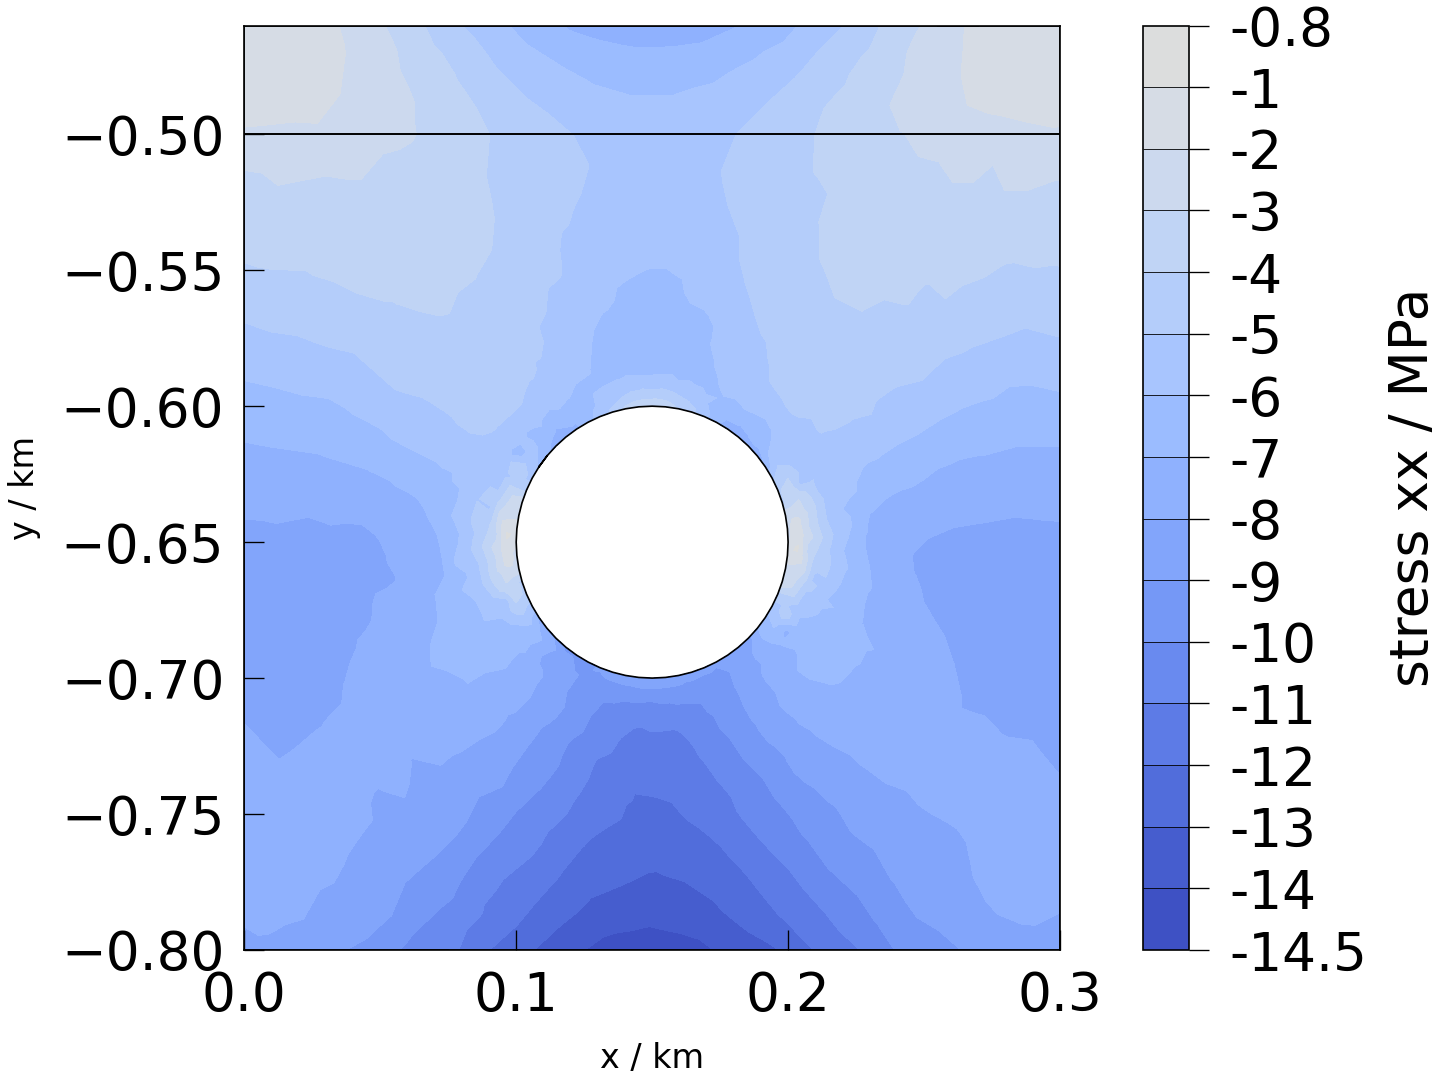
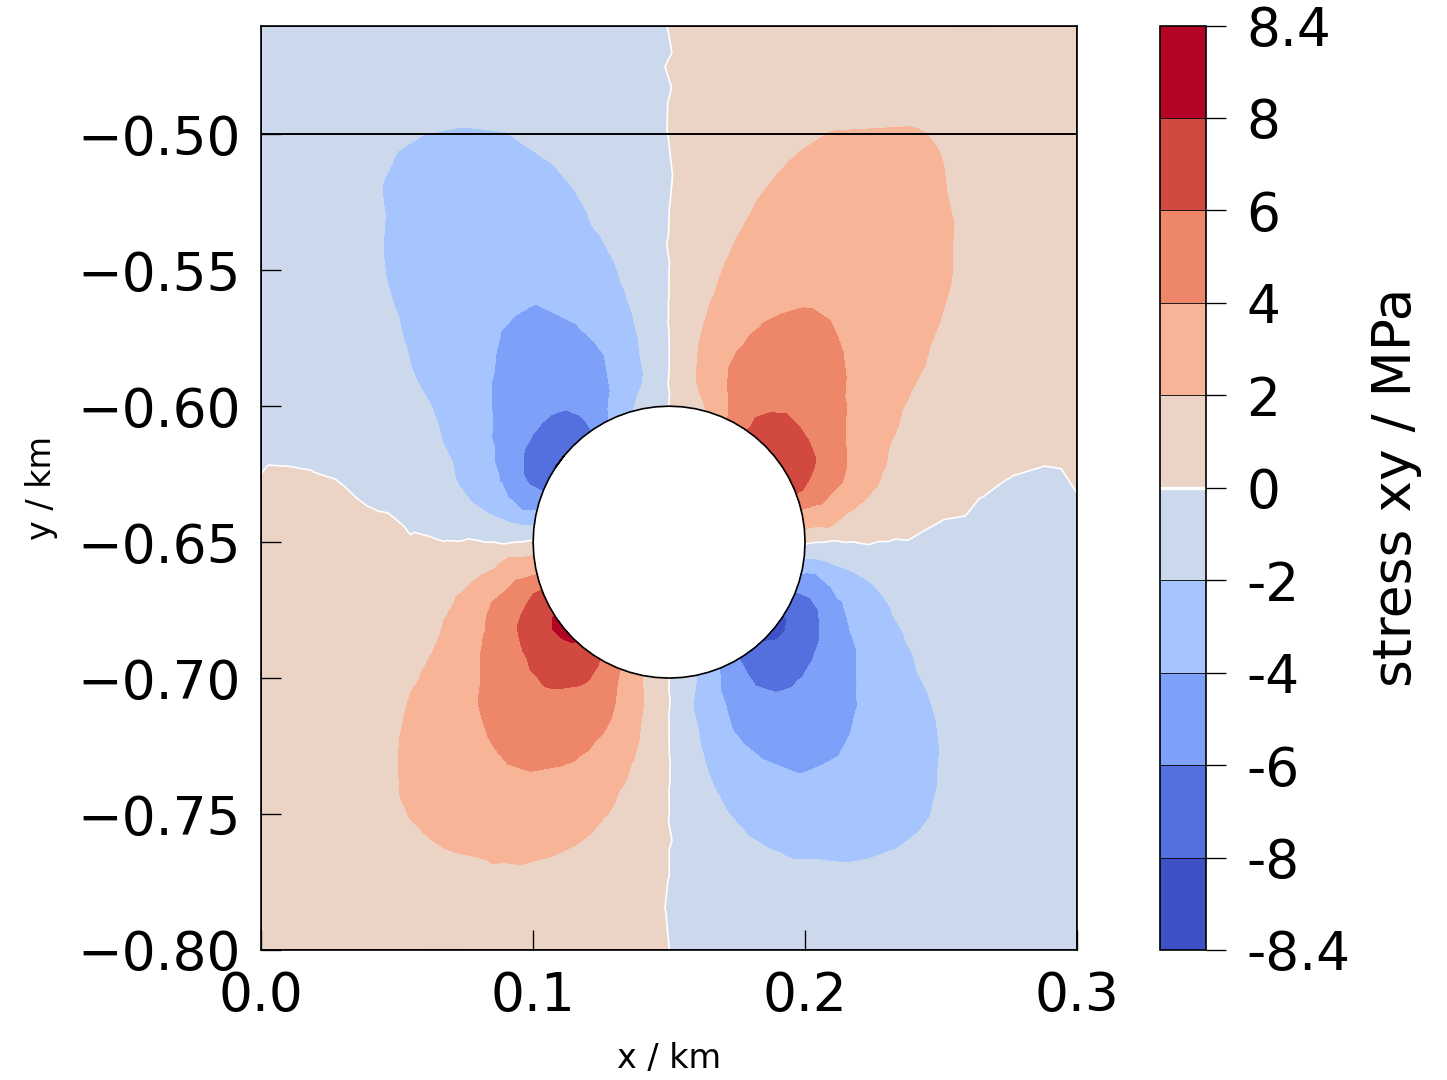
We can inspect the stress (or strain) tensor components by indexing.
fig = plot(mesh, properties.stress["xx"])
fig = plot(mesh, properties.stress["xy"])
Principal stresses#
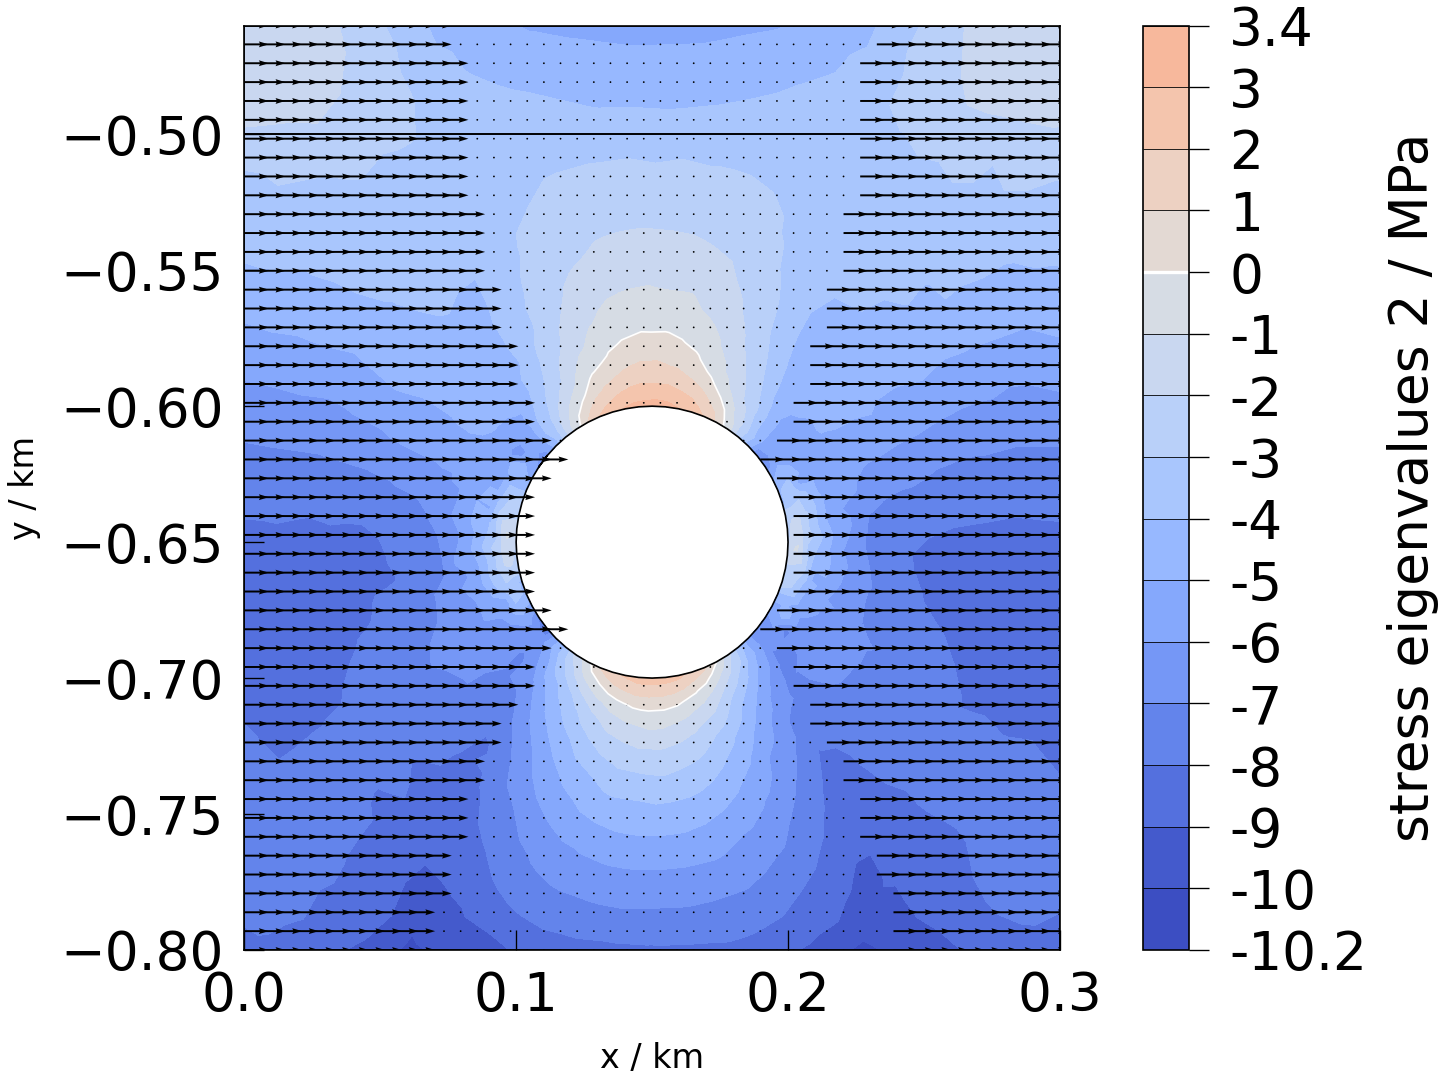
Let’s plot the the principal stress components and also overlay the direction of the corresponding eigenvector in the plot. Note: the eigenvalues are sorted by increasing order, i.e. eigenvalue[0] is the most negative / largest compressive principal stress.
eigvecs = properties.stress.eigenvectors
fig = plot(mesh, mesh_property=properties.stress.eigenvalues[0])
plot_streamlines(
    ax=fig.axes[0], mesh=mesh, mesh_property=eigvecs[0], plot_type="lines"
)
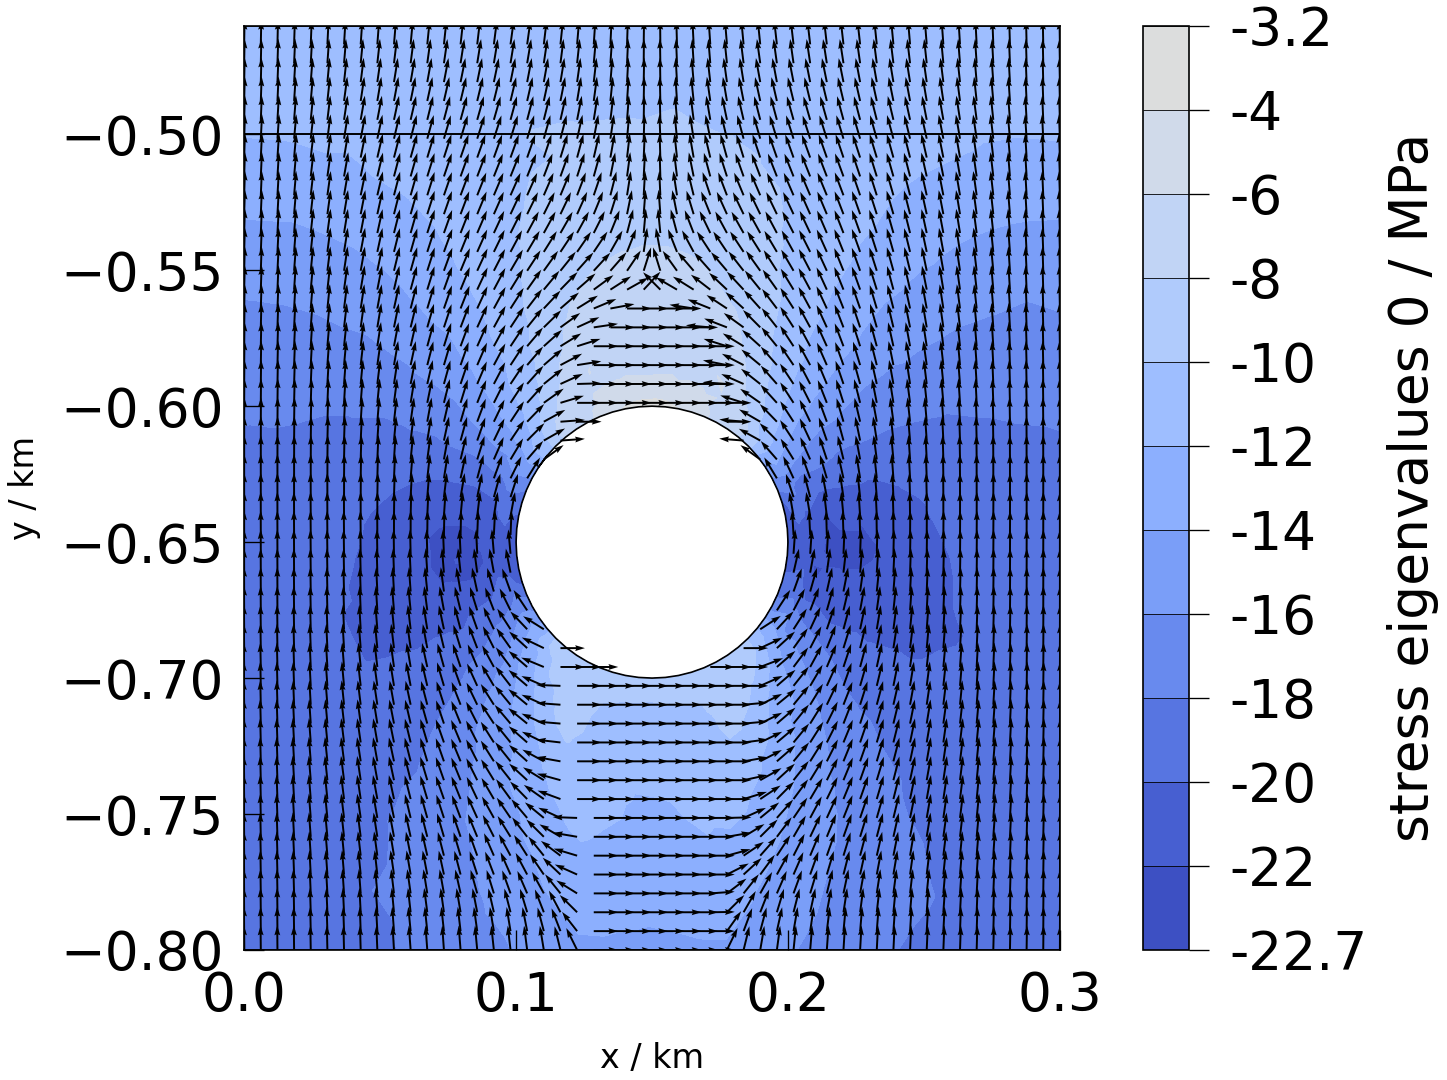
fig = plot(mesh, mesh_property=properties.stress.eigenvalues[1])
plot_streamlines(
    ax=fig.axes[0], mesh=mesh, mesh_property=eigvecs[1], plot_type="lines"
)
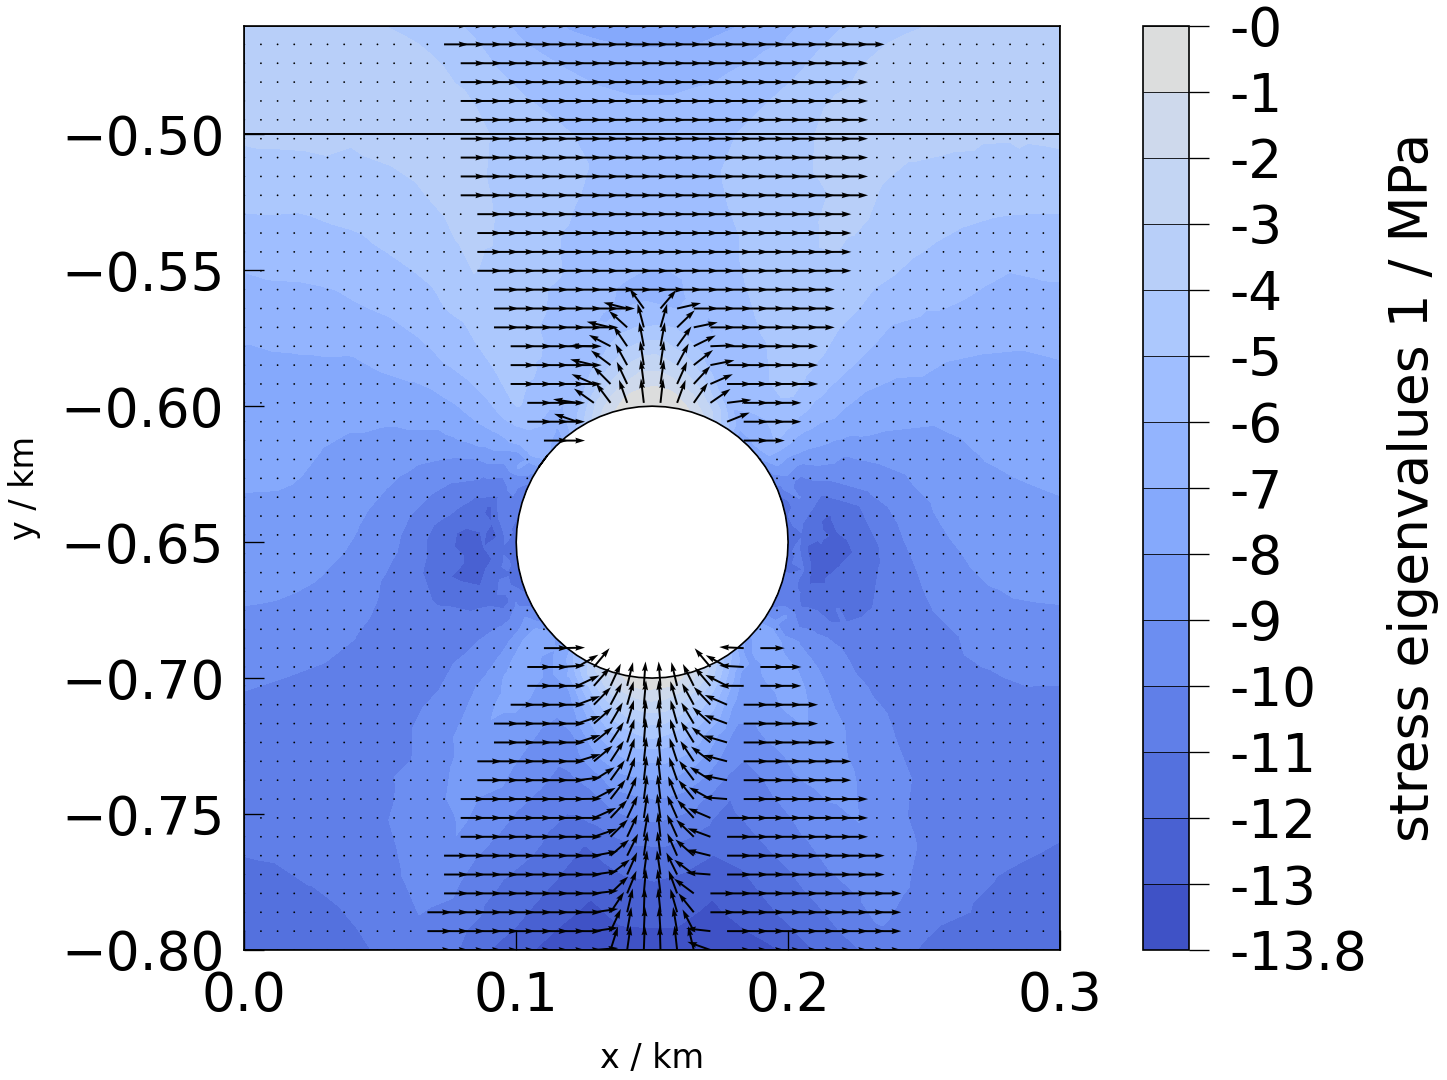
fig = plot(mesh, mesh_property=properties.stress.eigenvalues[2])
plot_streamlines(
    ax=fig.axes[0], mesh=mesh, mesh_property=eigvecs[2], plot_type="lines"
)
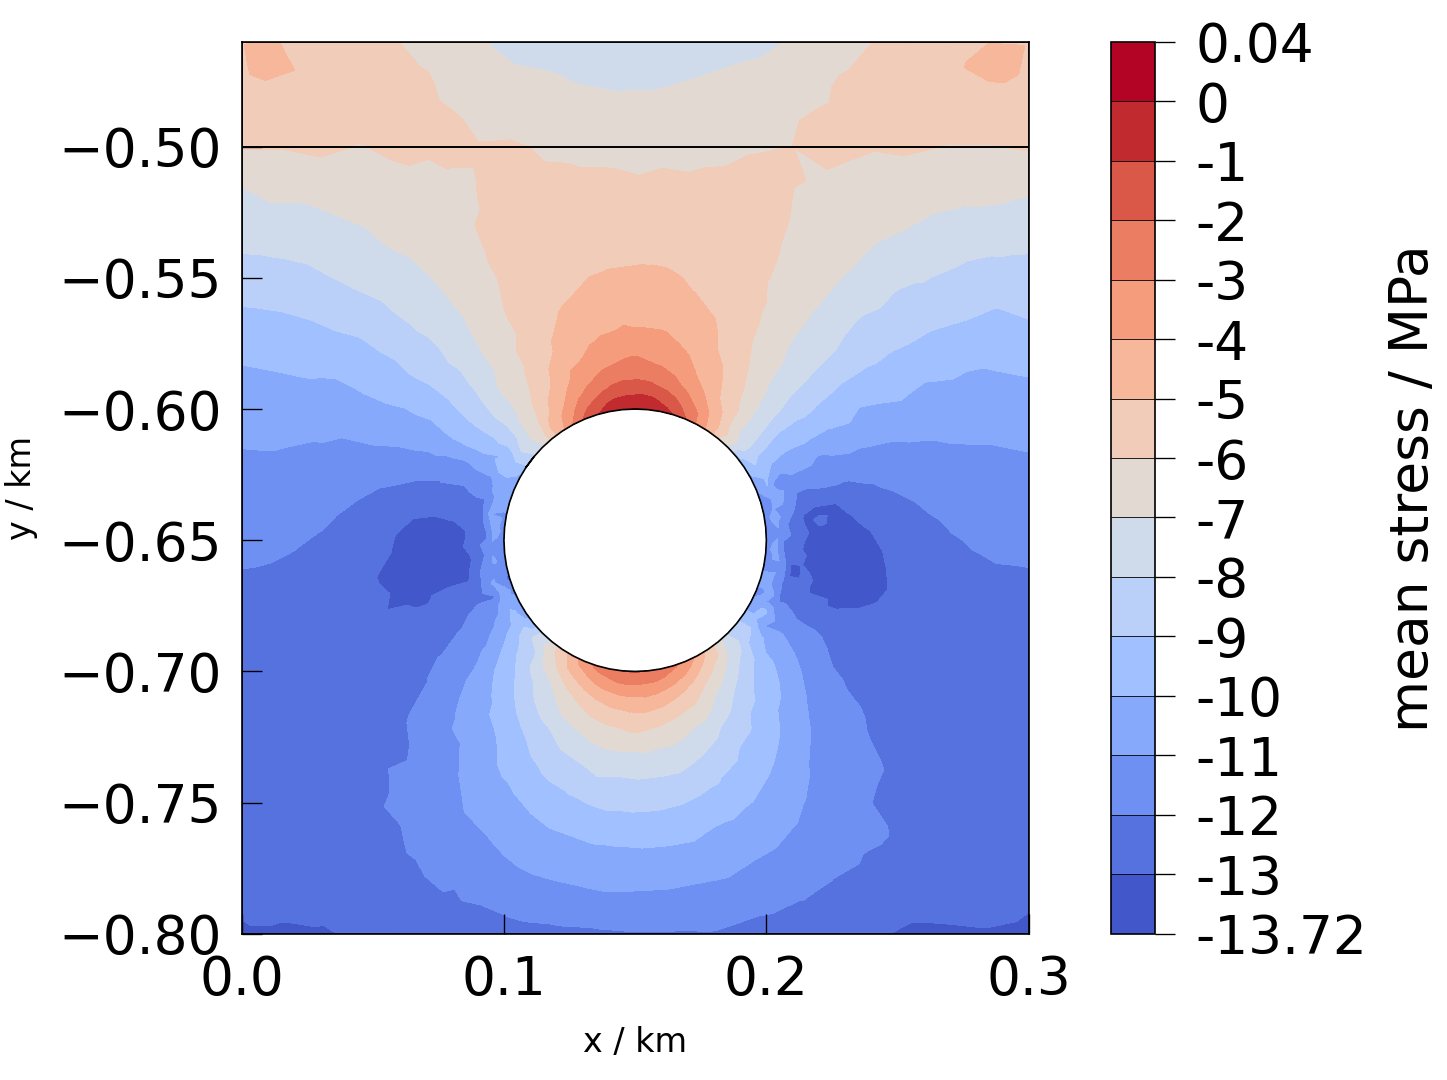
We can also plot the mean of the principal stress, i.e. the magnitude of the
hydrostatic component of the stress tensor.
see: ogstools.propertylib.tensor_math.mean()
fig = plot(mesh, properties.stress.mean)
Von Mises stress#
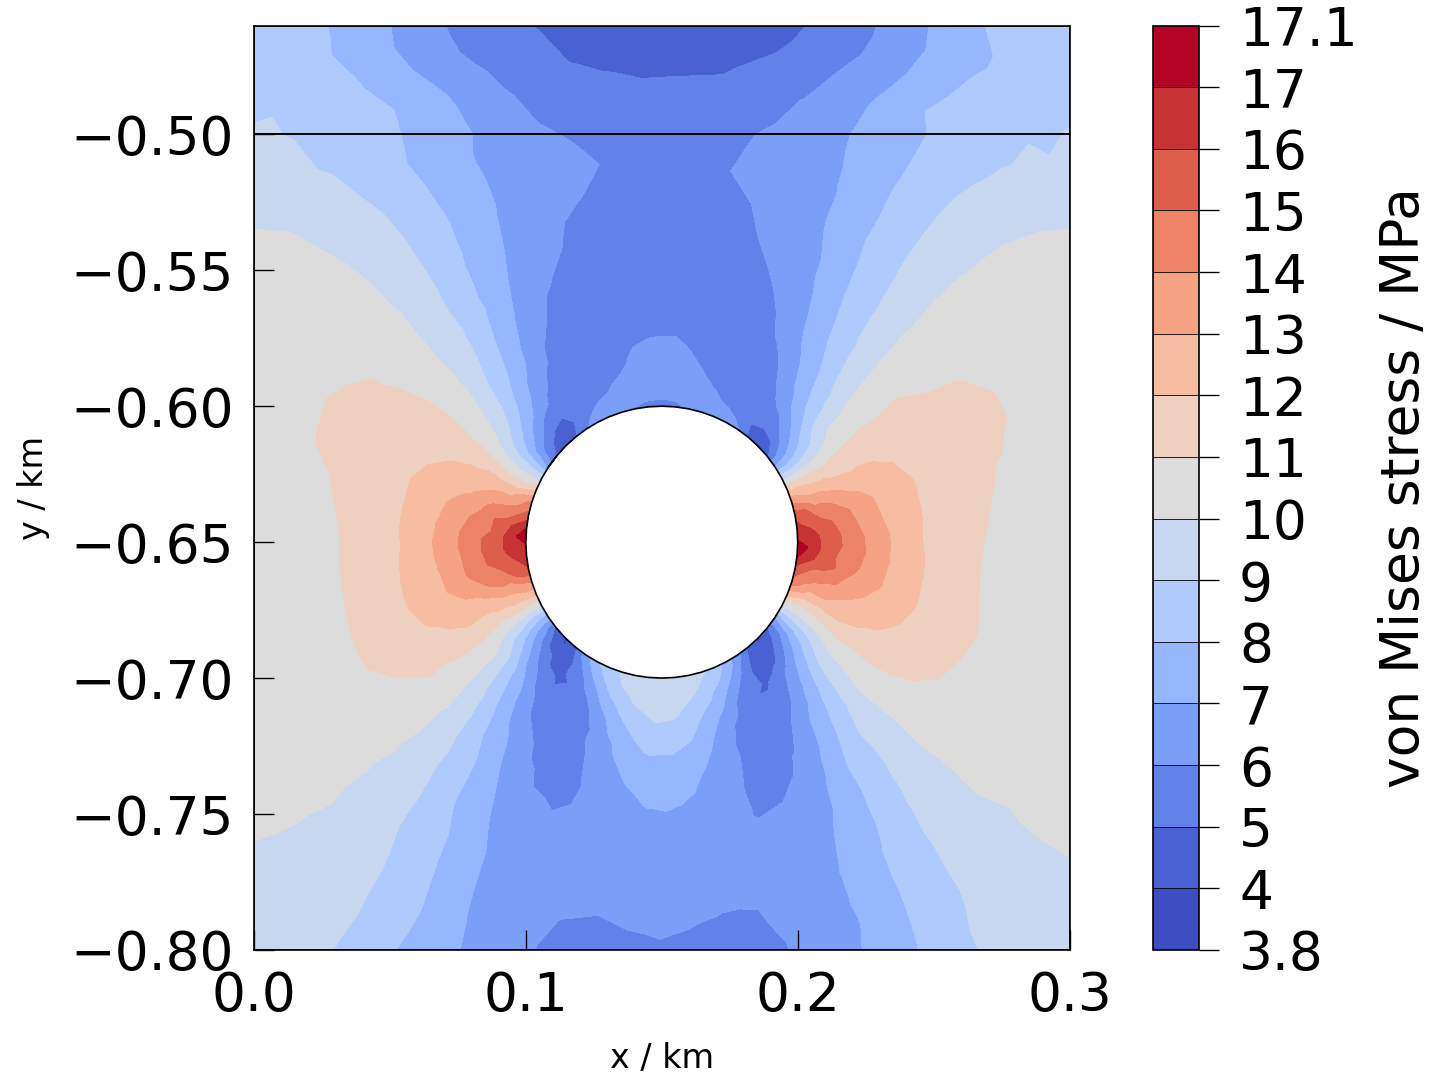
see: ogstools.propertylib.tensor_math.von_mises()
fig = plot(mesh, properties.stress.von_Mises)
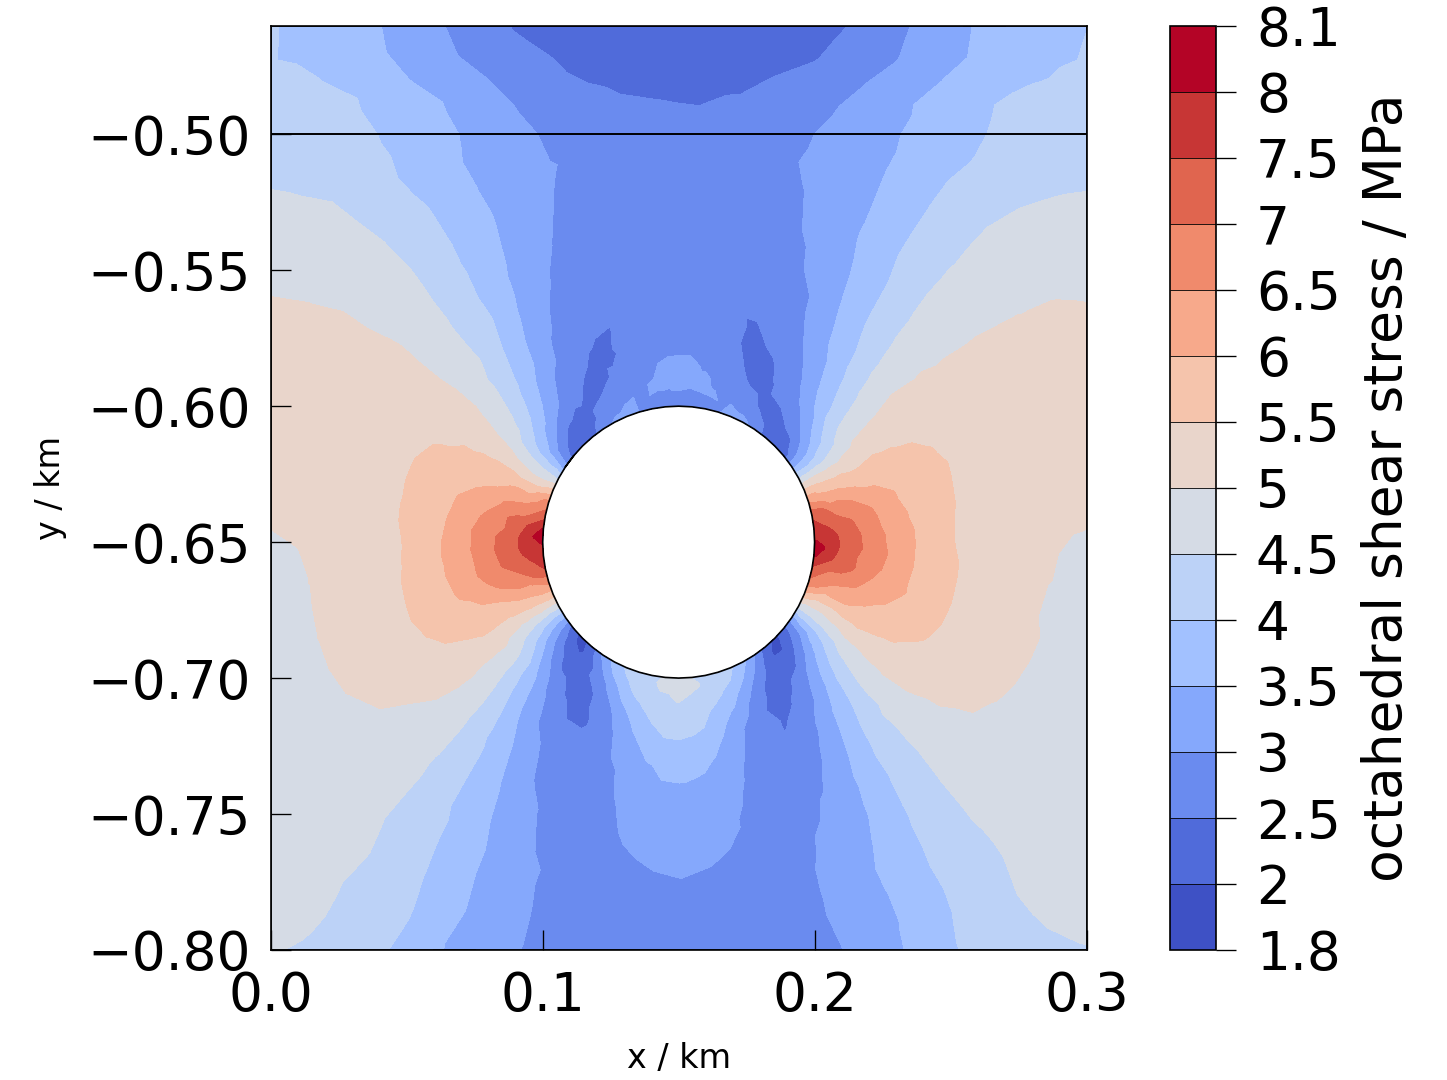
octahedral shear stress#
see: ogstools.propertylib.tensor_math.octahedral_shear()
fig = plot(mesh, properties.stress.octahedral_shear)
Integrity criteria#
Evaluating models regarding their integrity is often dependent on the
geometry, e.g. for a hypothetical water column proportional to the depth.
Presets which fall under this category make use of
ogstools.propertylib.mesh_dependent.
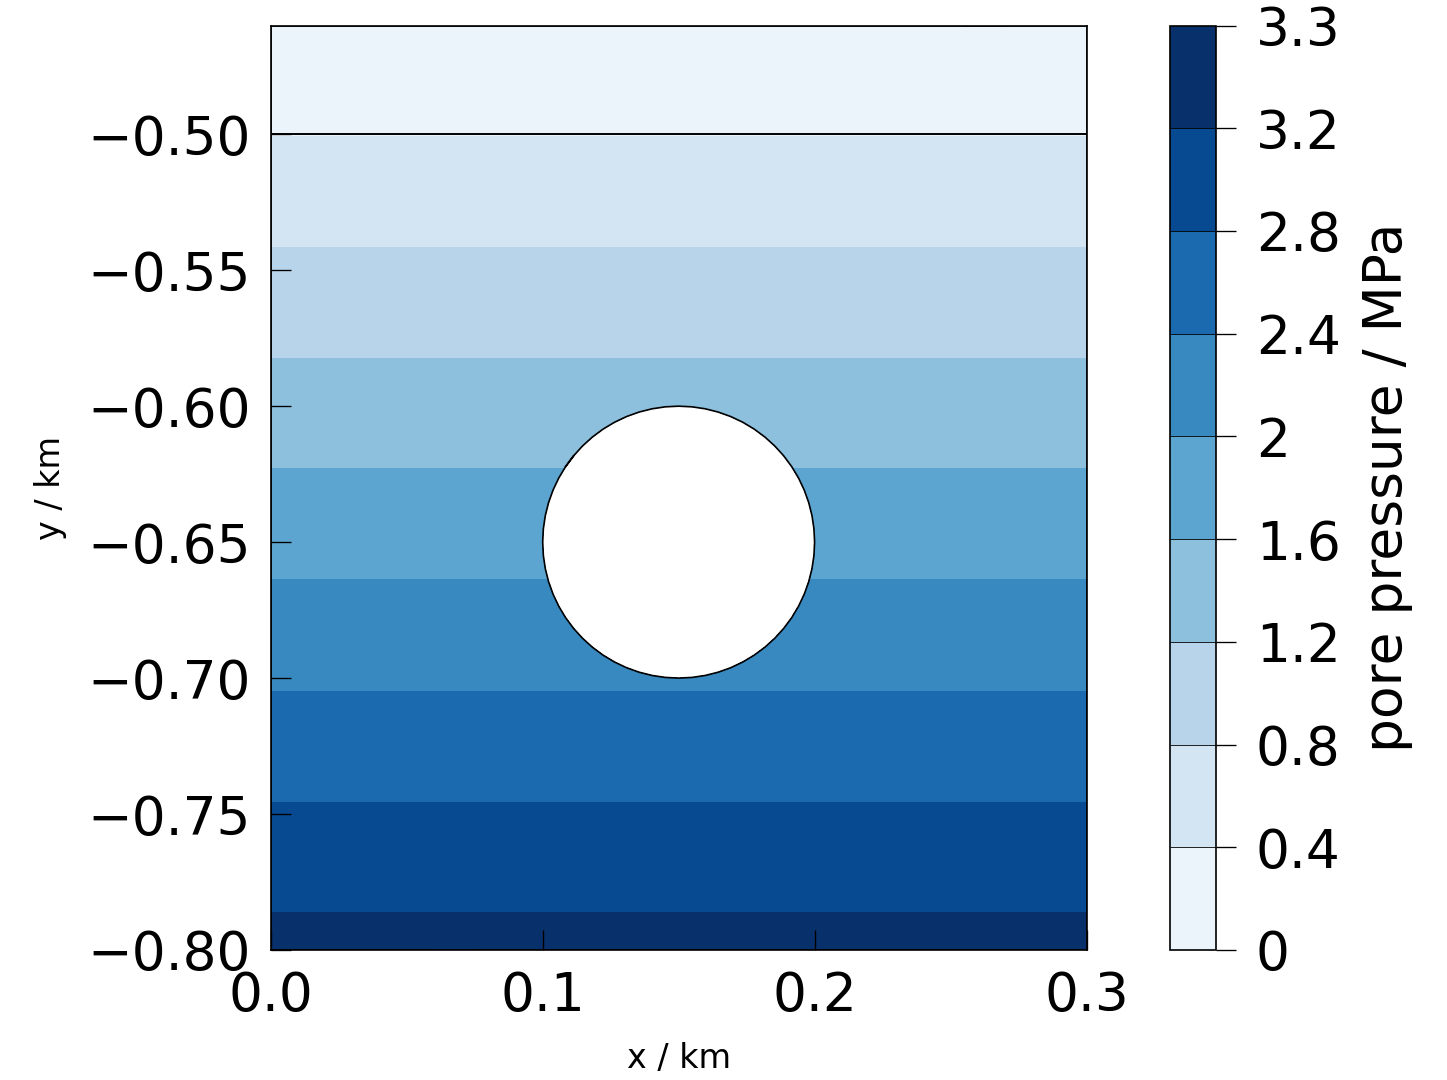
The hypothetical water column used in the integrity criteria would initially use existing “pressure” data in the mesh, otherwise it is automatically calculated as the following:
mesh["pressure"] = mesh_dependent.p_fluid(mesh)
fig = plot(mesh, properties.pressure)
/builds/ogs/tools/ogstools/.venv-devcontainer/lib/python3.9/site-packages/pyvista/core/dataset.py:1975: UnitStrippedWarning: The unit of the quantity is stripped when downcasting to ndarray.
  scalars = np.asanyarray(scalars)
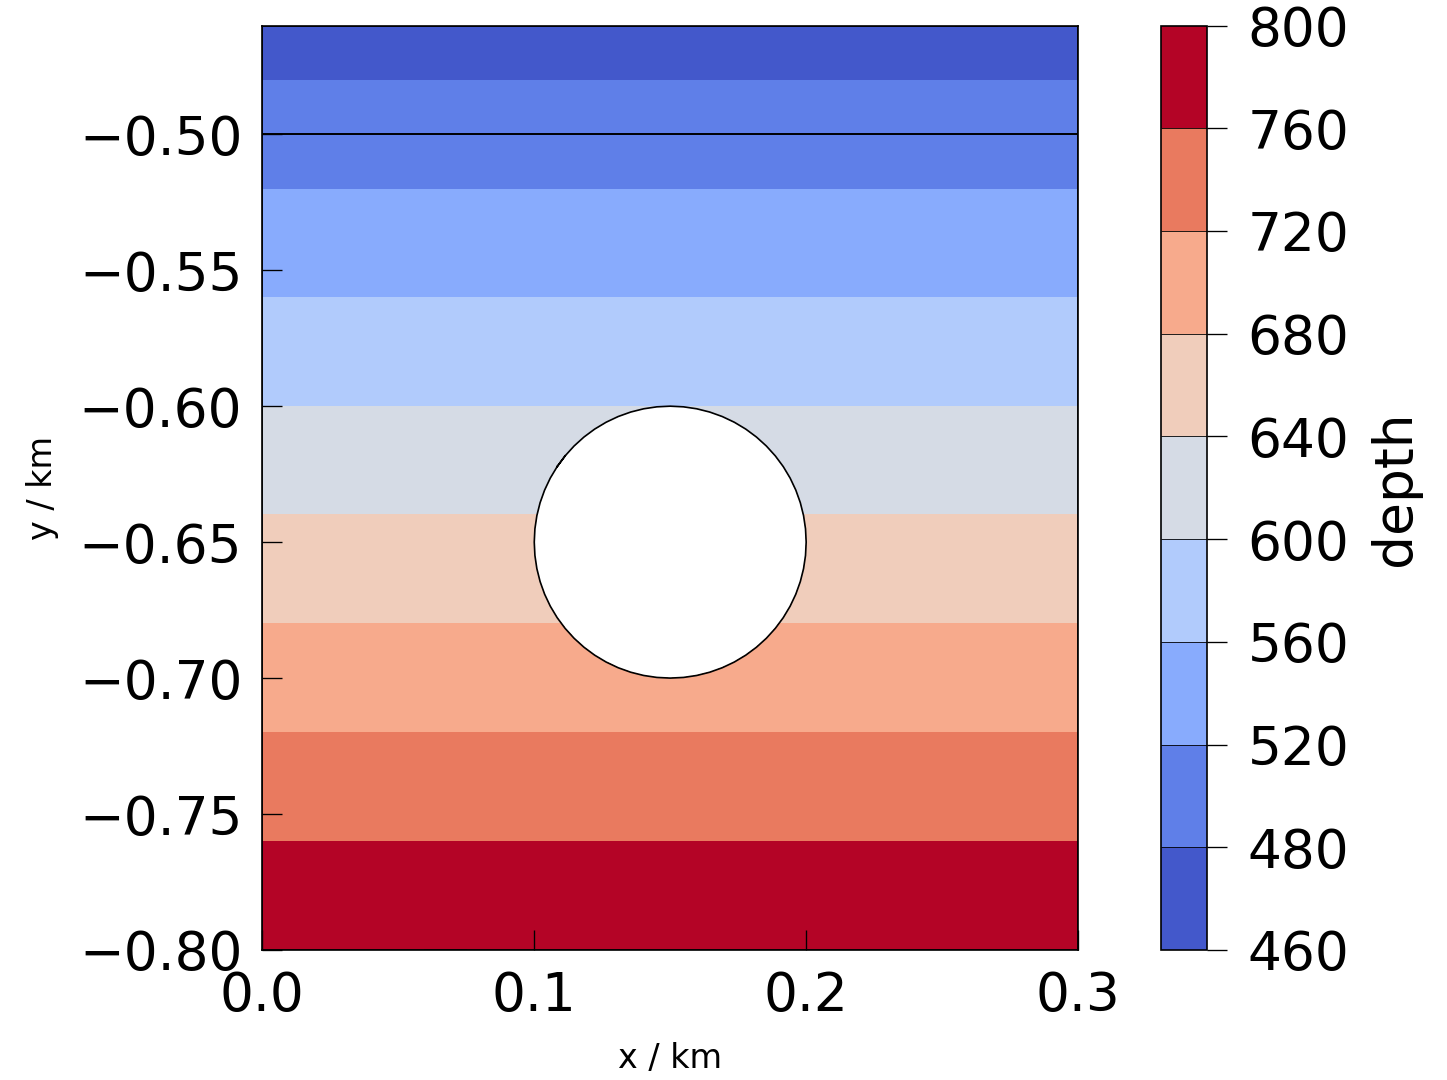
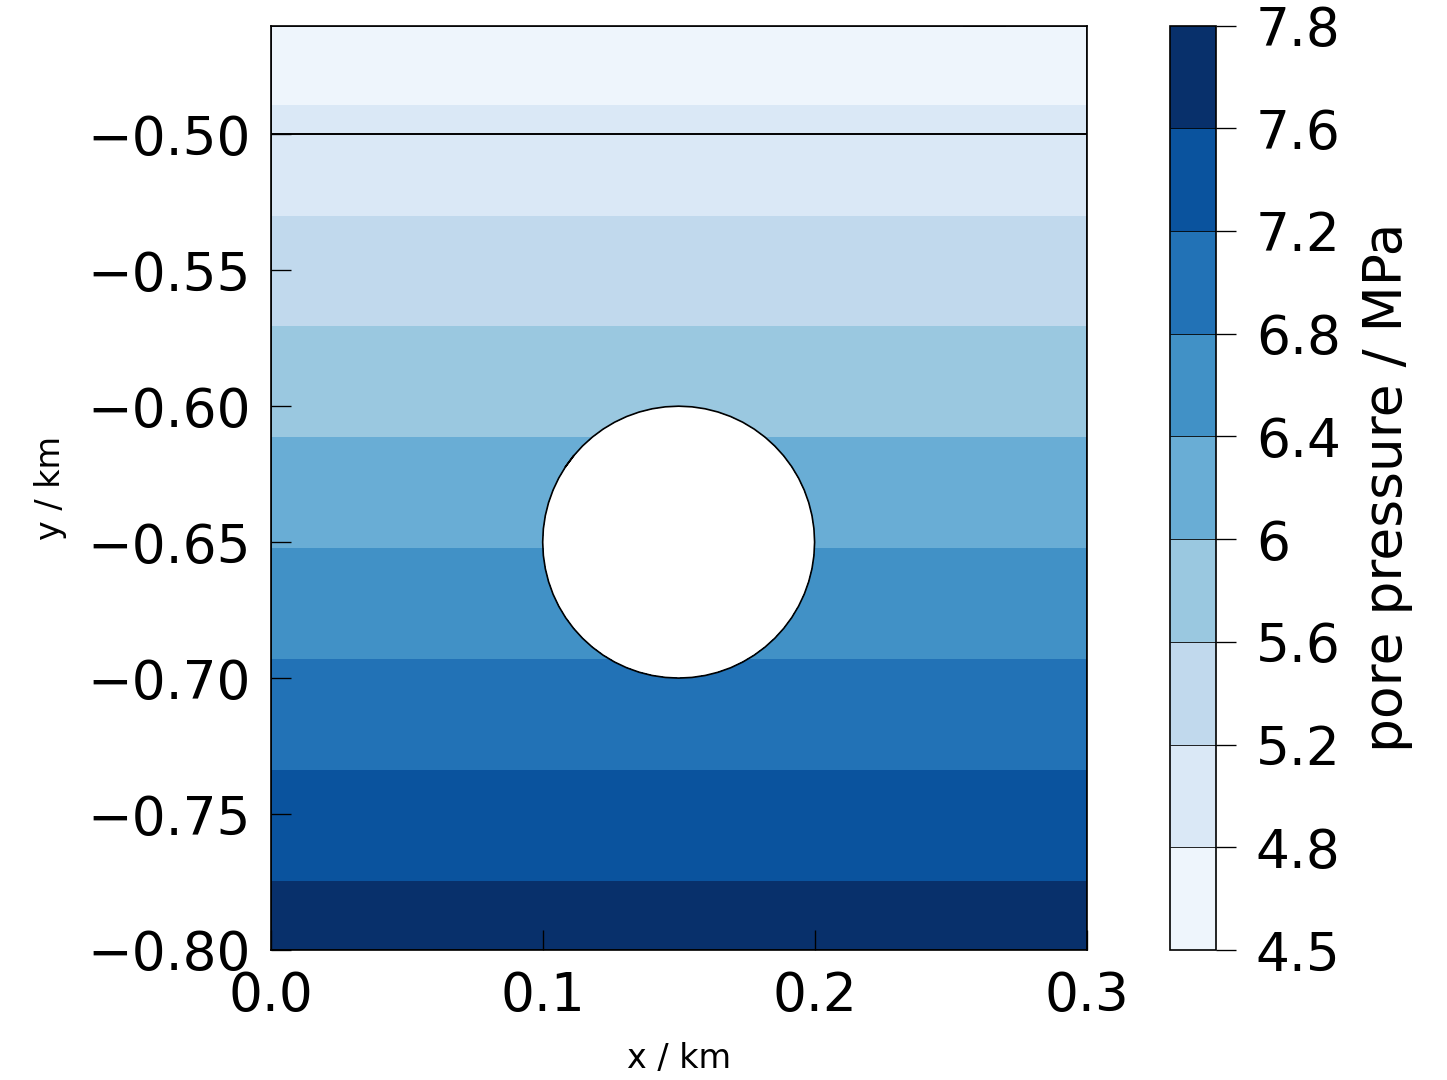
But since this assumes that the top of the model is equal to the ground surface, the resulting pressure is underestimated. In this case we have to correct the depth manually. Then the pressure is calculated correctly:
mesh["depth"] = mesh_dependent.depth(mesh, use_coords=True)
fig = plot(mesh, "depth")
mesh["pressure"] = mesh_dependent.p_fluid(mesh)
fig = plot(mesh, properties.pressure)
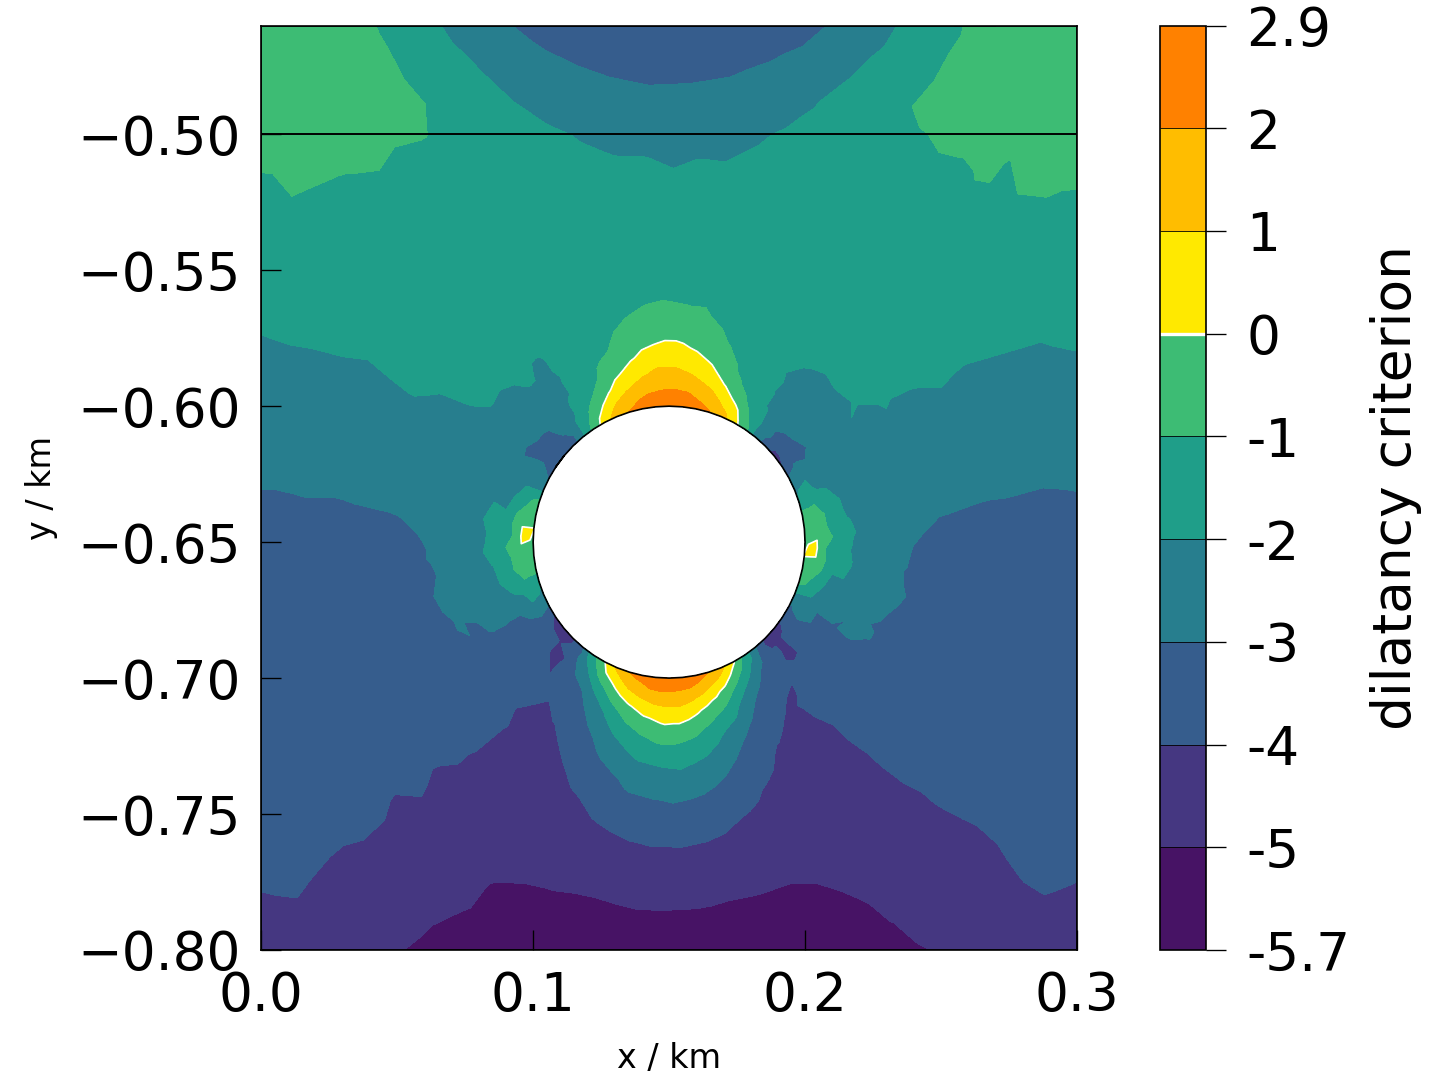
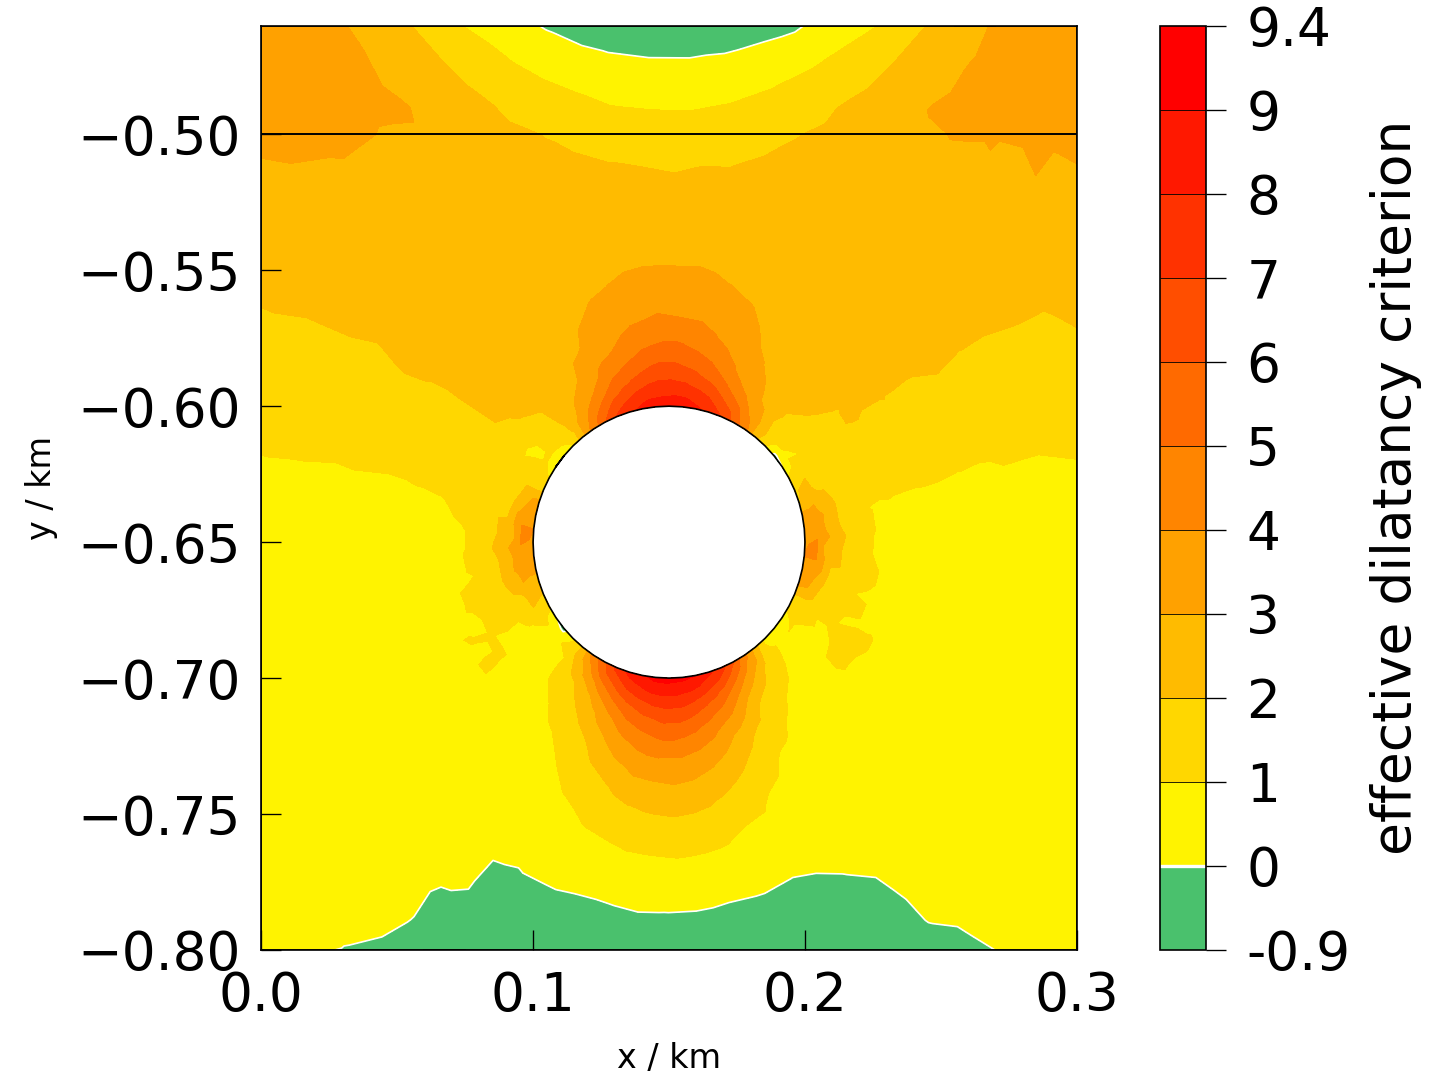
Dilantancy criterion#
see: ogstools.propertylib.mesh_dependent.dilatancy_critescu()
fig = plot(mesh, properties.dilatancy_critescu_tot)
fig = plot(mesh, properties.dilatancy_critescu_eff)
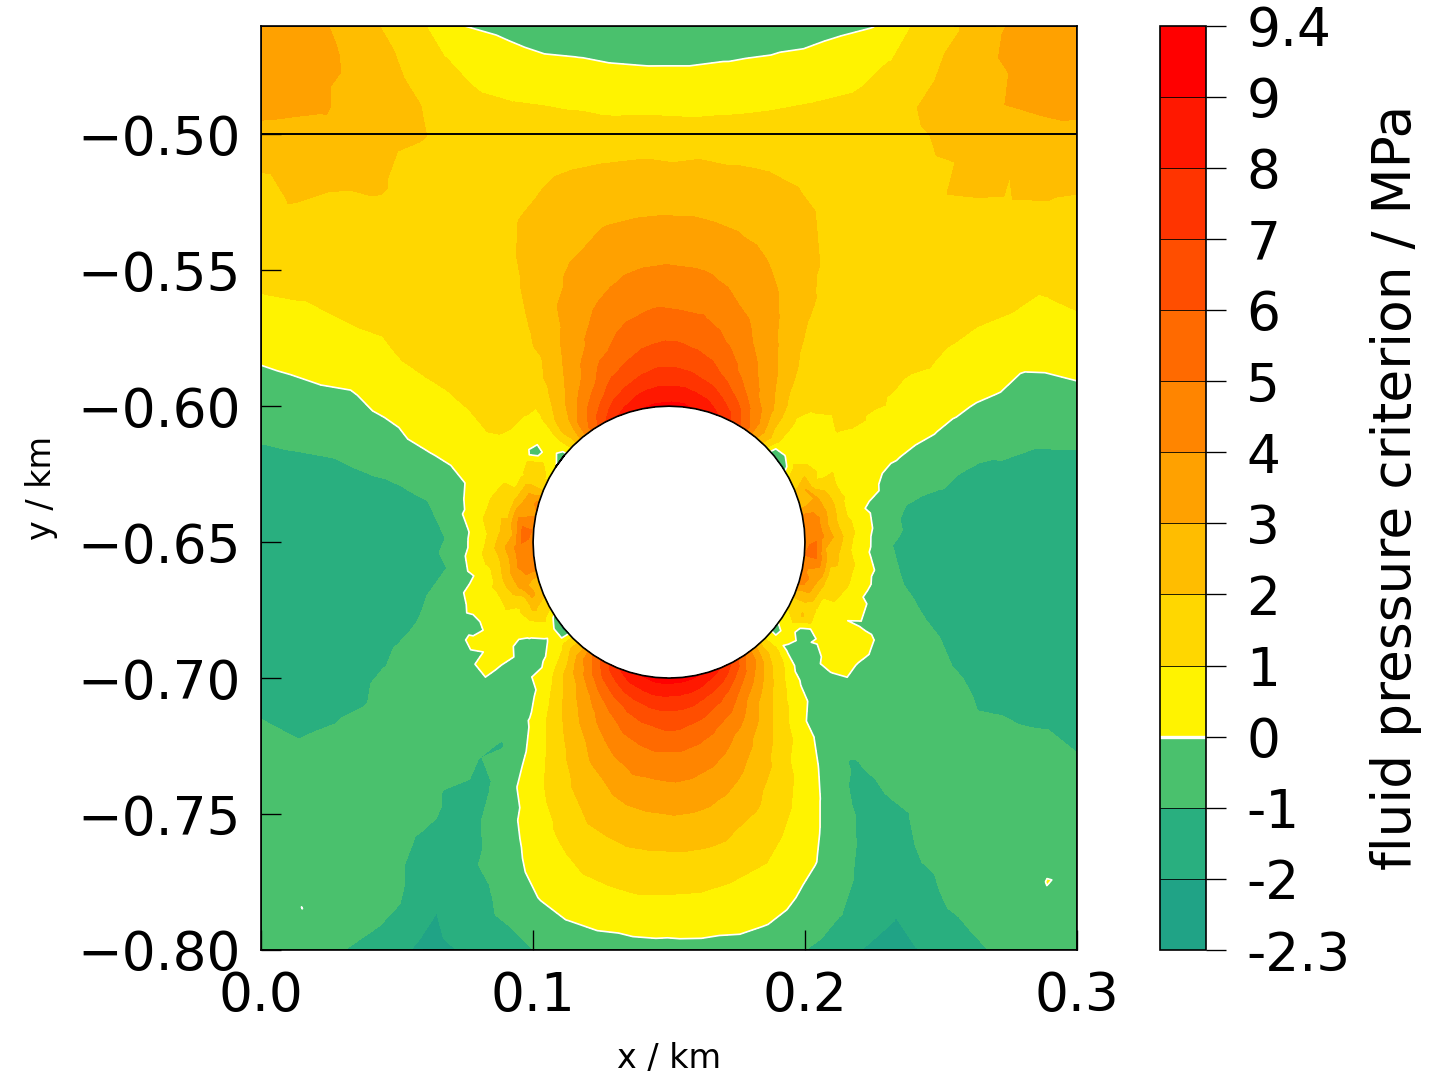
Fluid pressure criterion#
see: ogstools.propertylib.mesh_dependent.fluid_pressure_criterion()
fig = plot(mesh, properties.fluid_pressure_crit)
Total running time of the script: (0 minutes 6.357 seconds)

