Note
Go to the end to download the full example code.
Labeling directional shared axes#
Section author: Feliks Kiszkurno (Helmholtz Centre for Environmental Research GmbH - UFZ)
Warning
This example discusses functionality that may experience breaking changes in the near future!
For this example we load a 2D meshseries from within the meshplotlib
examples. This tutorial covers automatic labeling the directional axes (X and Y)
under various conditions (shared and nor shared X and Y axes).
Import Python packages, change some settings and load example data set
import matplotlib.pyplot as plt

from ogstools import examples
from ogstools.meshlib import difference
from ogstools.meshplotlib import (
    clear_labels,
    label_spatial_axes,
    plot,
    setup,
)
from ogstools.propertylib.properties import temperature

plt.rcParams.update({"font.size": 32})

setup.reset()
setup.length.output_unit = "km"
setup.combined_colorbar = False

meshseries = examples.load_meshseries_THM_2D_PVD()
mesh_a = meshseries.read(0)
mesh_b = meshseries.read(1)
First, by default (without shared axes) both X and Y axes will be labeled automatically. The default is that both axes are shared and this will be respected.
fig = plot([mesh_a, mesh_b], temperature)

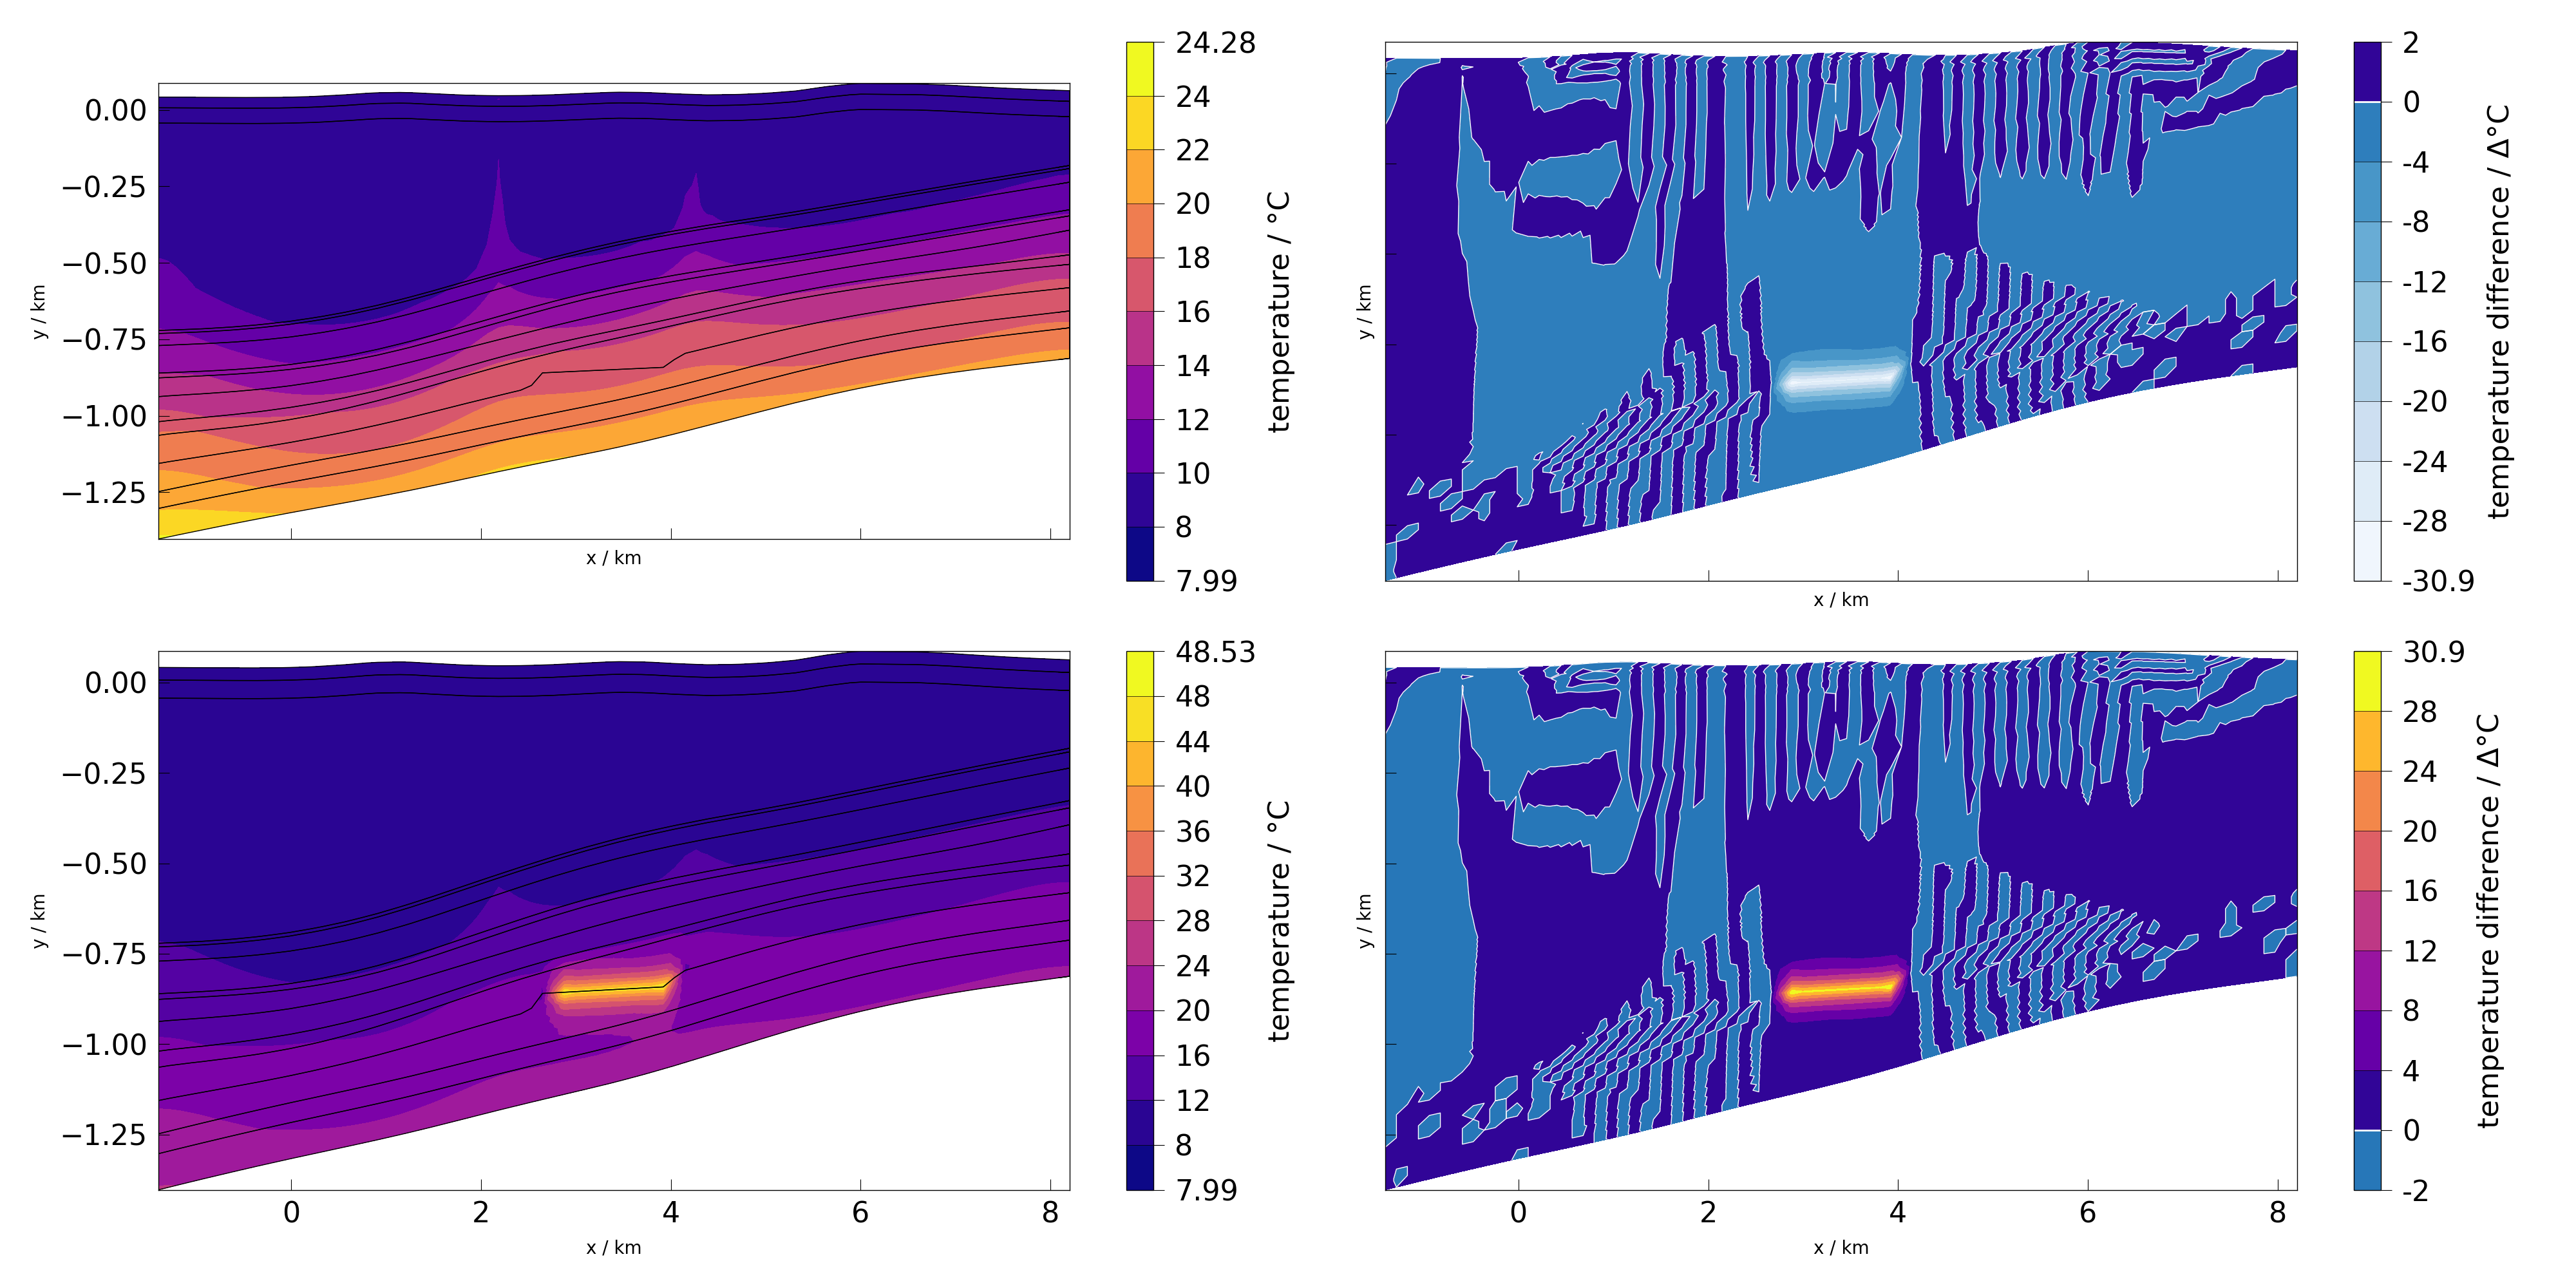
On user provided figure and axis, this behaviour is different. To allow for more complex combinations of plot functions, meshseries and process variables, the axis belonging to specific subplot has to be passed. In this case the default is to plot labels on each axis regardless of whether it is share or not.
fig, ax = plt.subplots(2, 2, figsize=(40, 20), sharex=True, sharey=True)
plot(mesh_a, temperature, fig=fig, ax=ax[0][0])
plot(mesh_b, temperature, fig=fig, ax=ax[1][0])
diff_ab = difference(mesh_a, mesh_b, temperature)
diff_ba = difference(mesh_b, mesh_a, temperature)
plot(diff_ab, temperature, fig=fig, ax=ax[0][1])
plot(diff_ba, temperature, fig=fig, ax=ax[1][1])
fig.tight_layout()

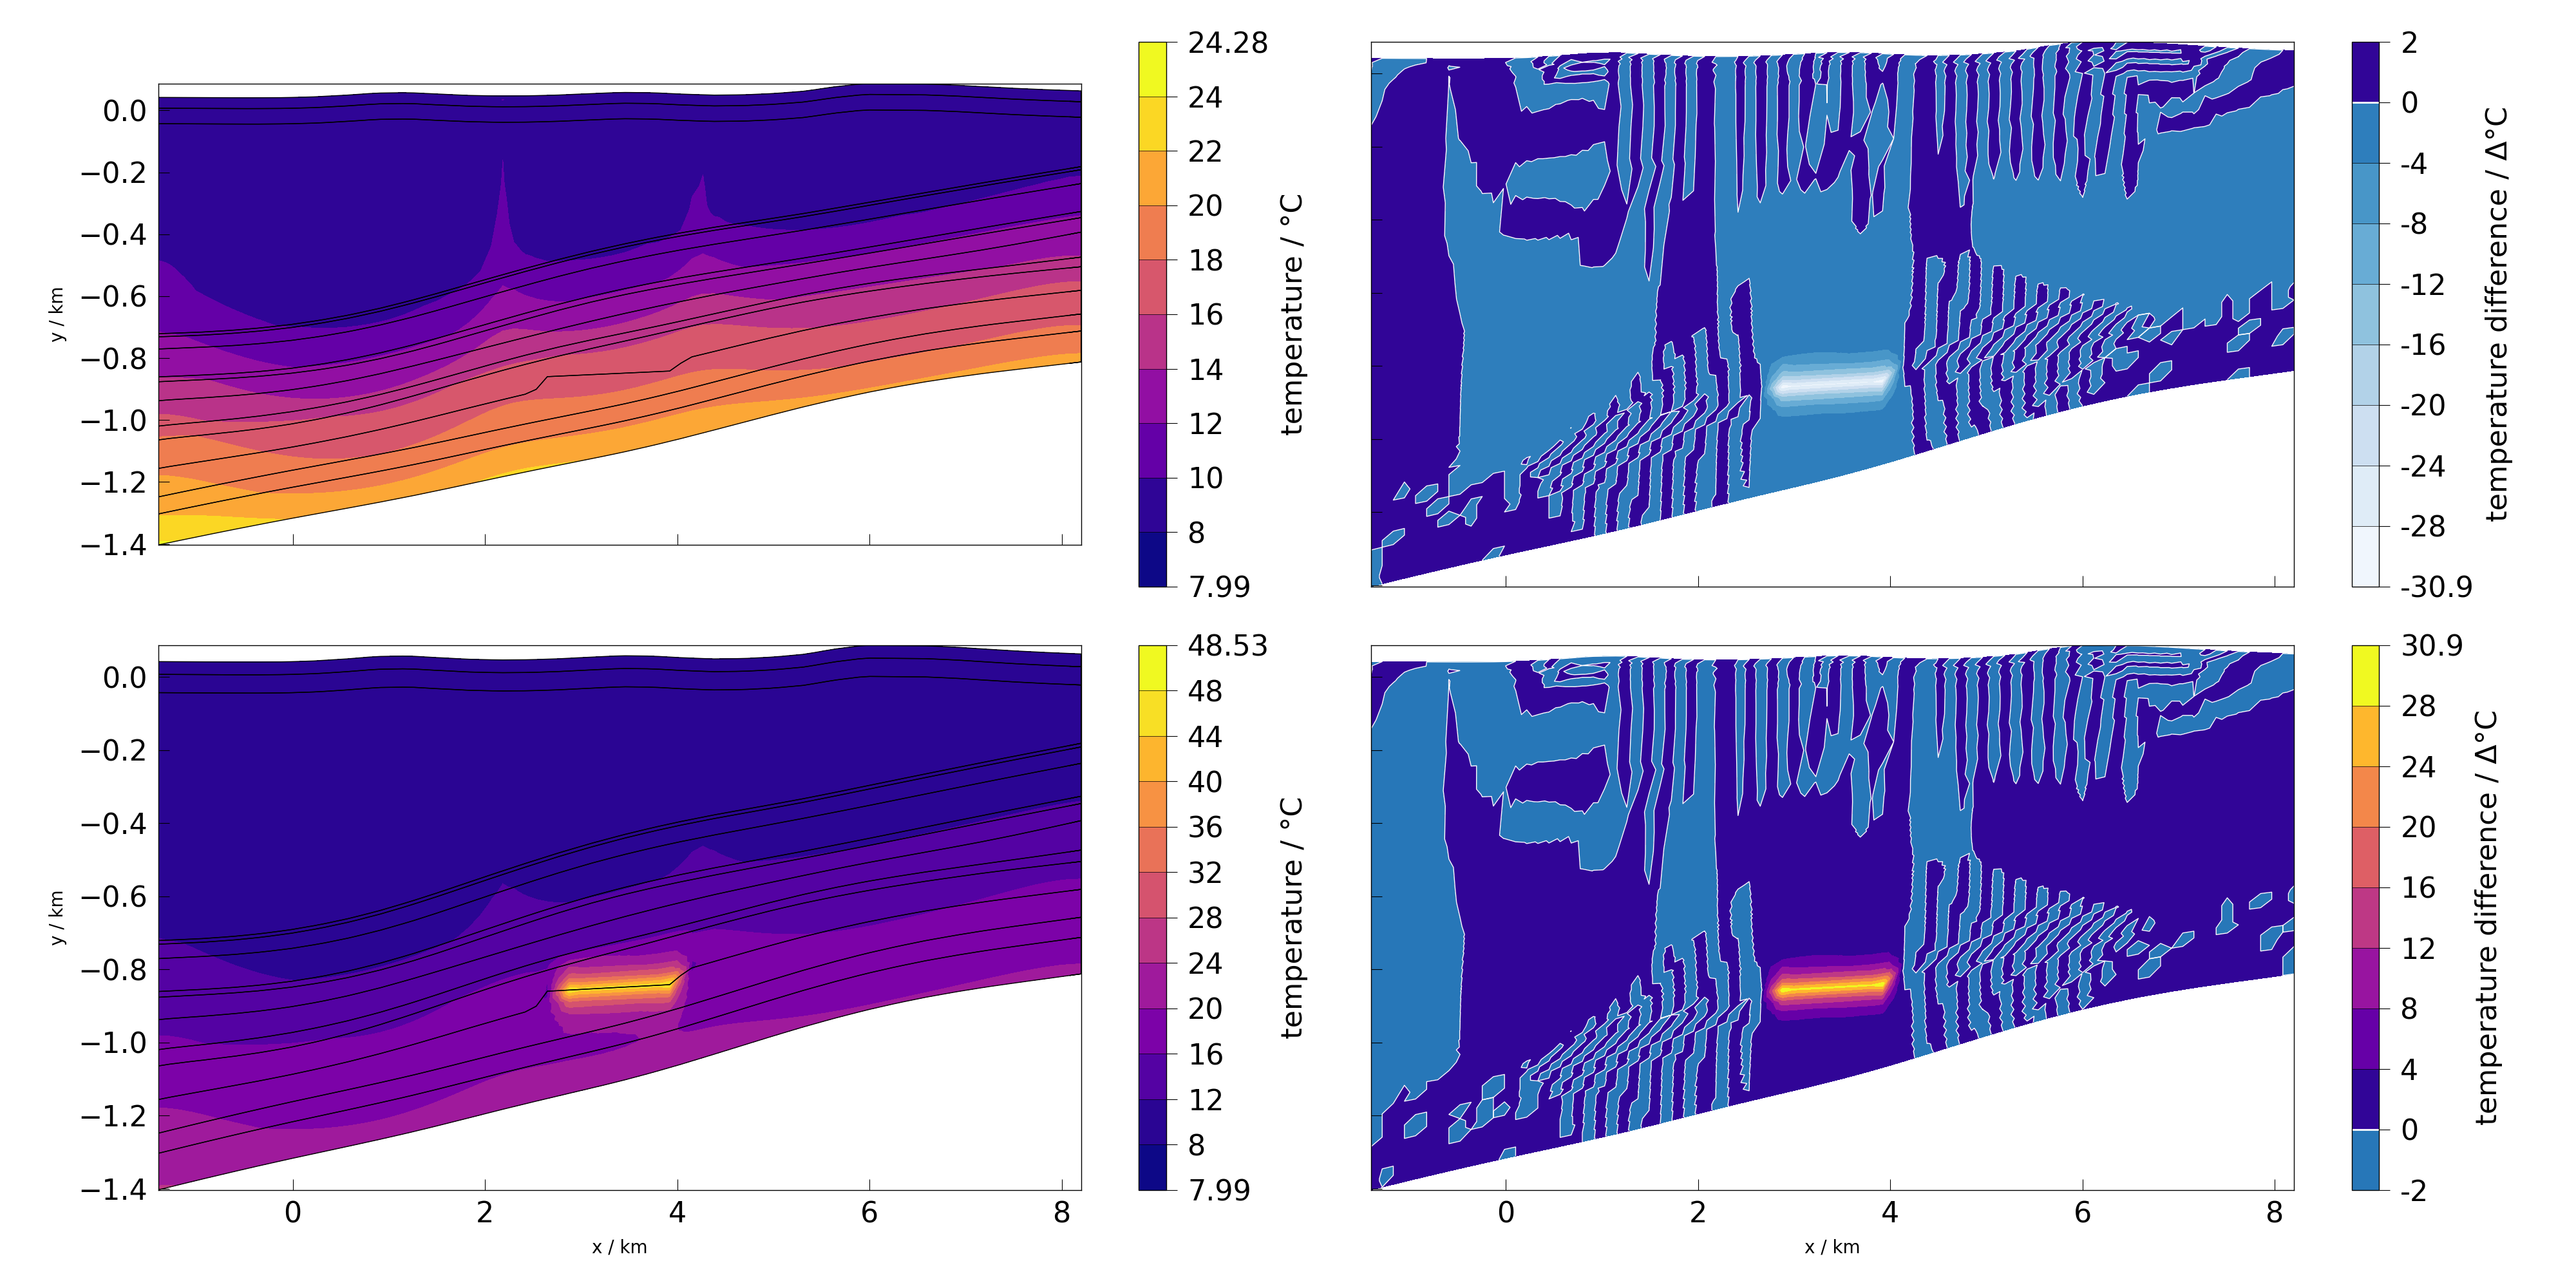
If user wishes to have labels respecting shared axes, they need to be first removed and applied again. Meshplotlib provides two function that make it easy: clear_labels and label_spatial_axes. They have to be called after the last plot related function call.
fig, ax = plt.subplots(2, 2, figsize=(40, 20), sharex=True, sharey=True)
plot(mesh_a, temperature, fig=fig, ax=ax[0][0])
plot(mesh_b, temperature, fig=fig, ax=ax[1][0])
plot(difference(mesh_a, mesh_b, temperature), temperature, fig=fig, ax=ax[0][1])
plot(difference(mesh_b, mesh_a, temperature), temperature, fig=fig, ax=ax[1][1])
clear_labels(ax)
label_spatial_axes(ax)
fig.tight_layout()

Total running time of the script: (0 minutes 3.536 seconds)
