Note
Go to the end to download the full example code.
Plotting different process variables on already existing Matplotlib figures / axes#
Section author: Feliks Kiszkurno (Helmholtz Centre for Environmental Research GmbH - UFZ)
For this example we load a 2D meshseries from within the meshplotlib
examples. This tutorial covers using meshplotlib to plot meshseries data using
Matplotlib objects for Figure and / or Axis. This is useful if different
plotting functions from Meshplotlib are to be used on different subplots
within the same figure.
Import Python packages, change some settings and load example data set
import matplotlib.pyplot as plt

from ogstools import examples
from ogstools.meshlib import difference
from ogstools.meshplotlib import plot, setup
from ogstools.propertylib import properties

plt.rcParams.update({"font.size": 32})

setup.reset()
setup.length.output_unit = "km"

meshseries = examples.load_meshseries_THM_2D_PVD()
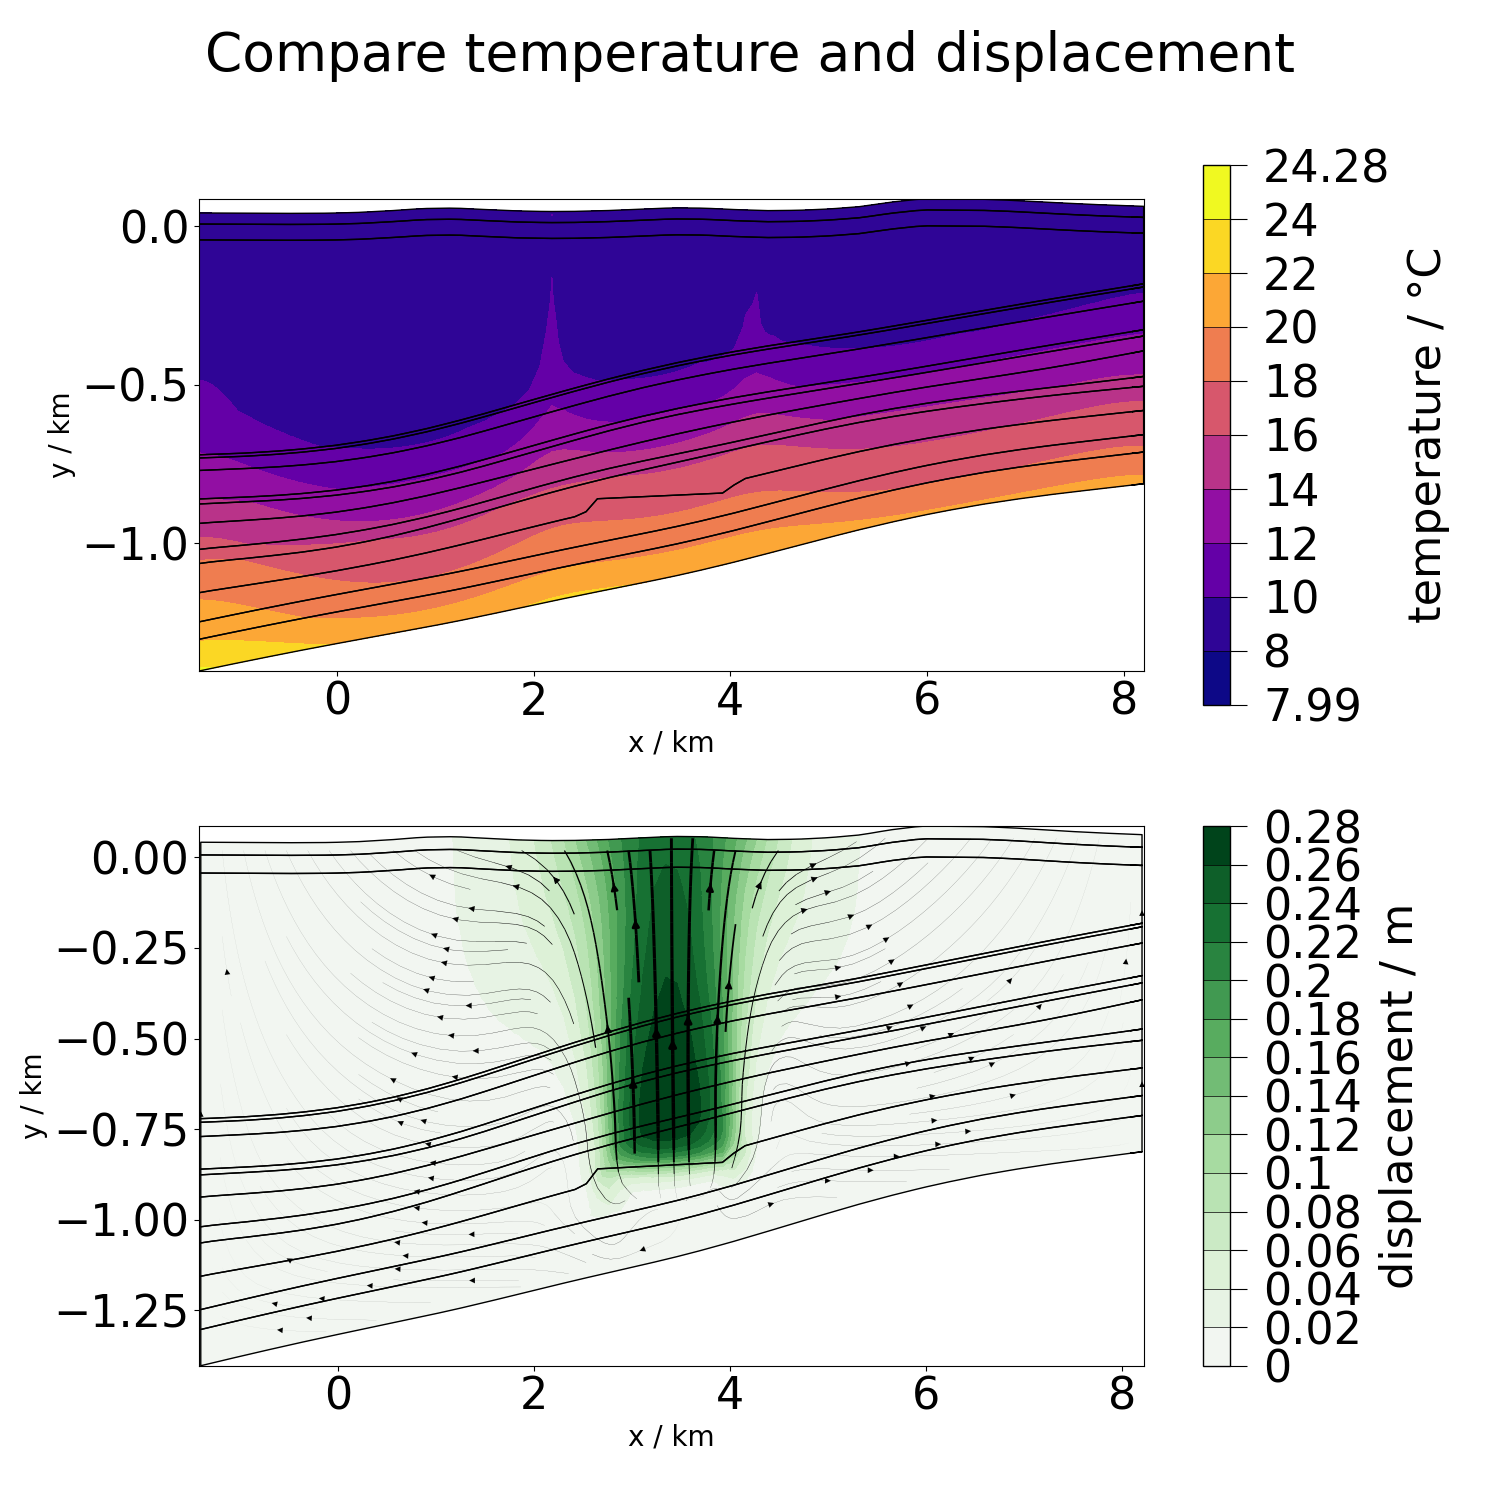
It is possible to plot various process parameter in different subplots of the same figure. But each mesh series and parameter pair need a separate call of plot function:
setup.combined_colorbar = False
fig, ax = plt.subplots(2, 1, figsize=(15, 15))
plot(meshseries.read(0), properties.temperature, fig=fig, ax=ax[0])
plot(meshseries.read(1), properties.displacement, fig=fig, ax=ax[1])
fig.suptitle("Compare temperature and displacement")
fig.tight_layout()

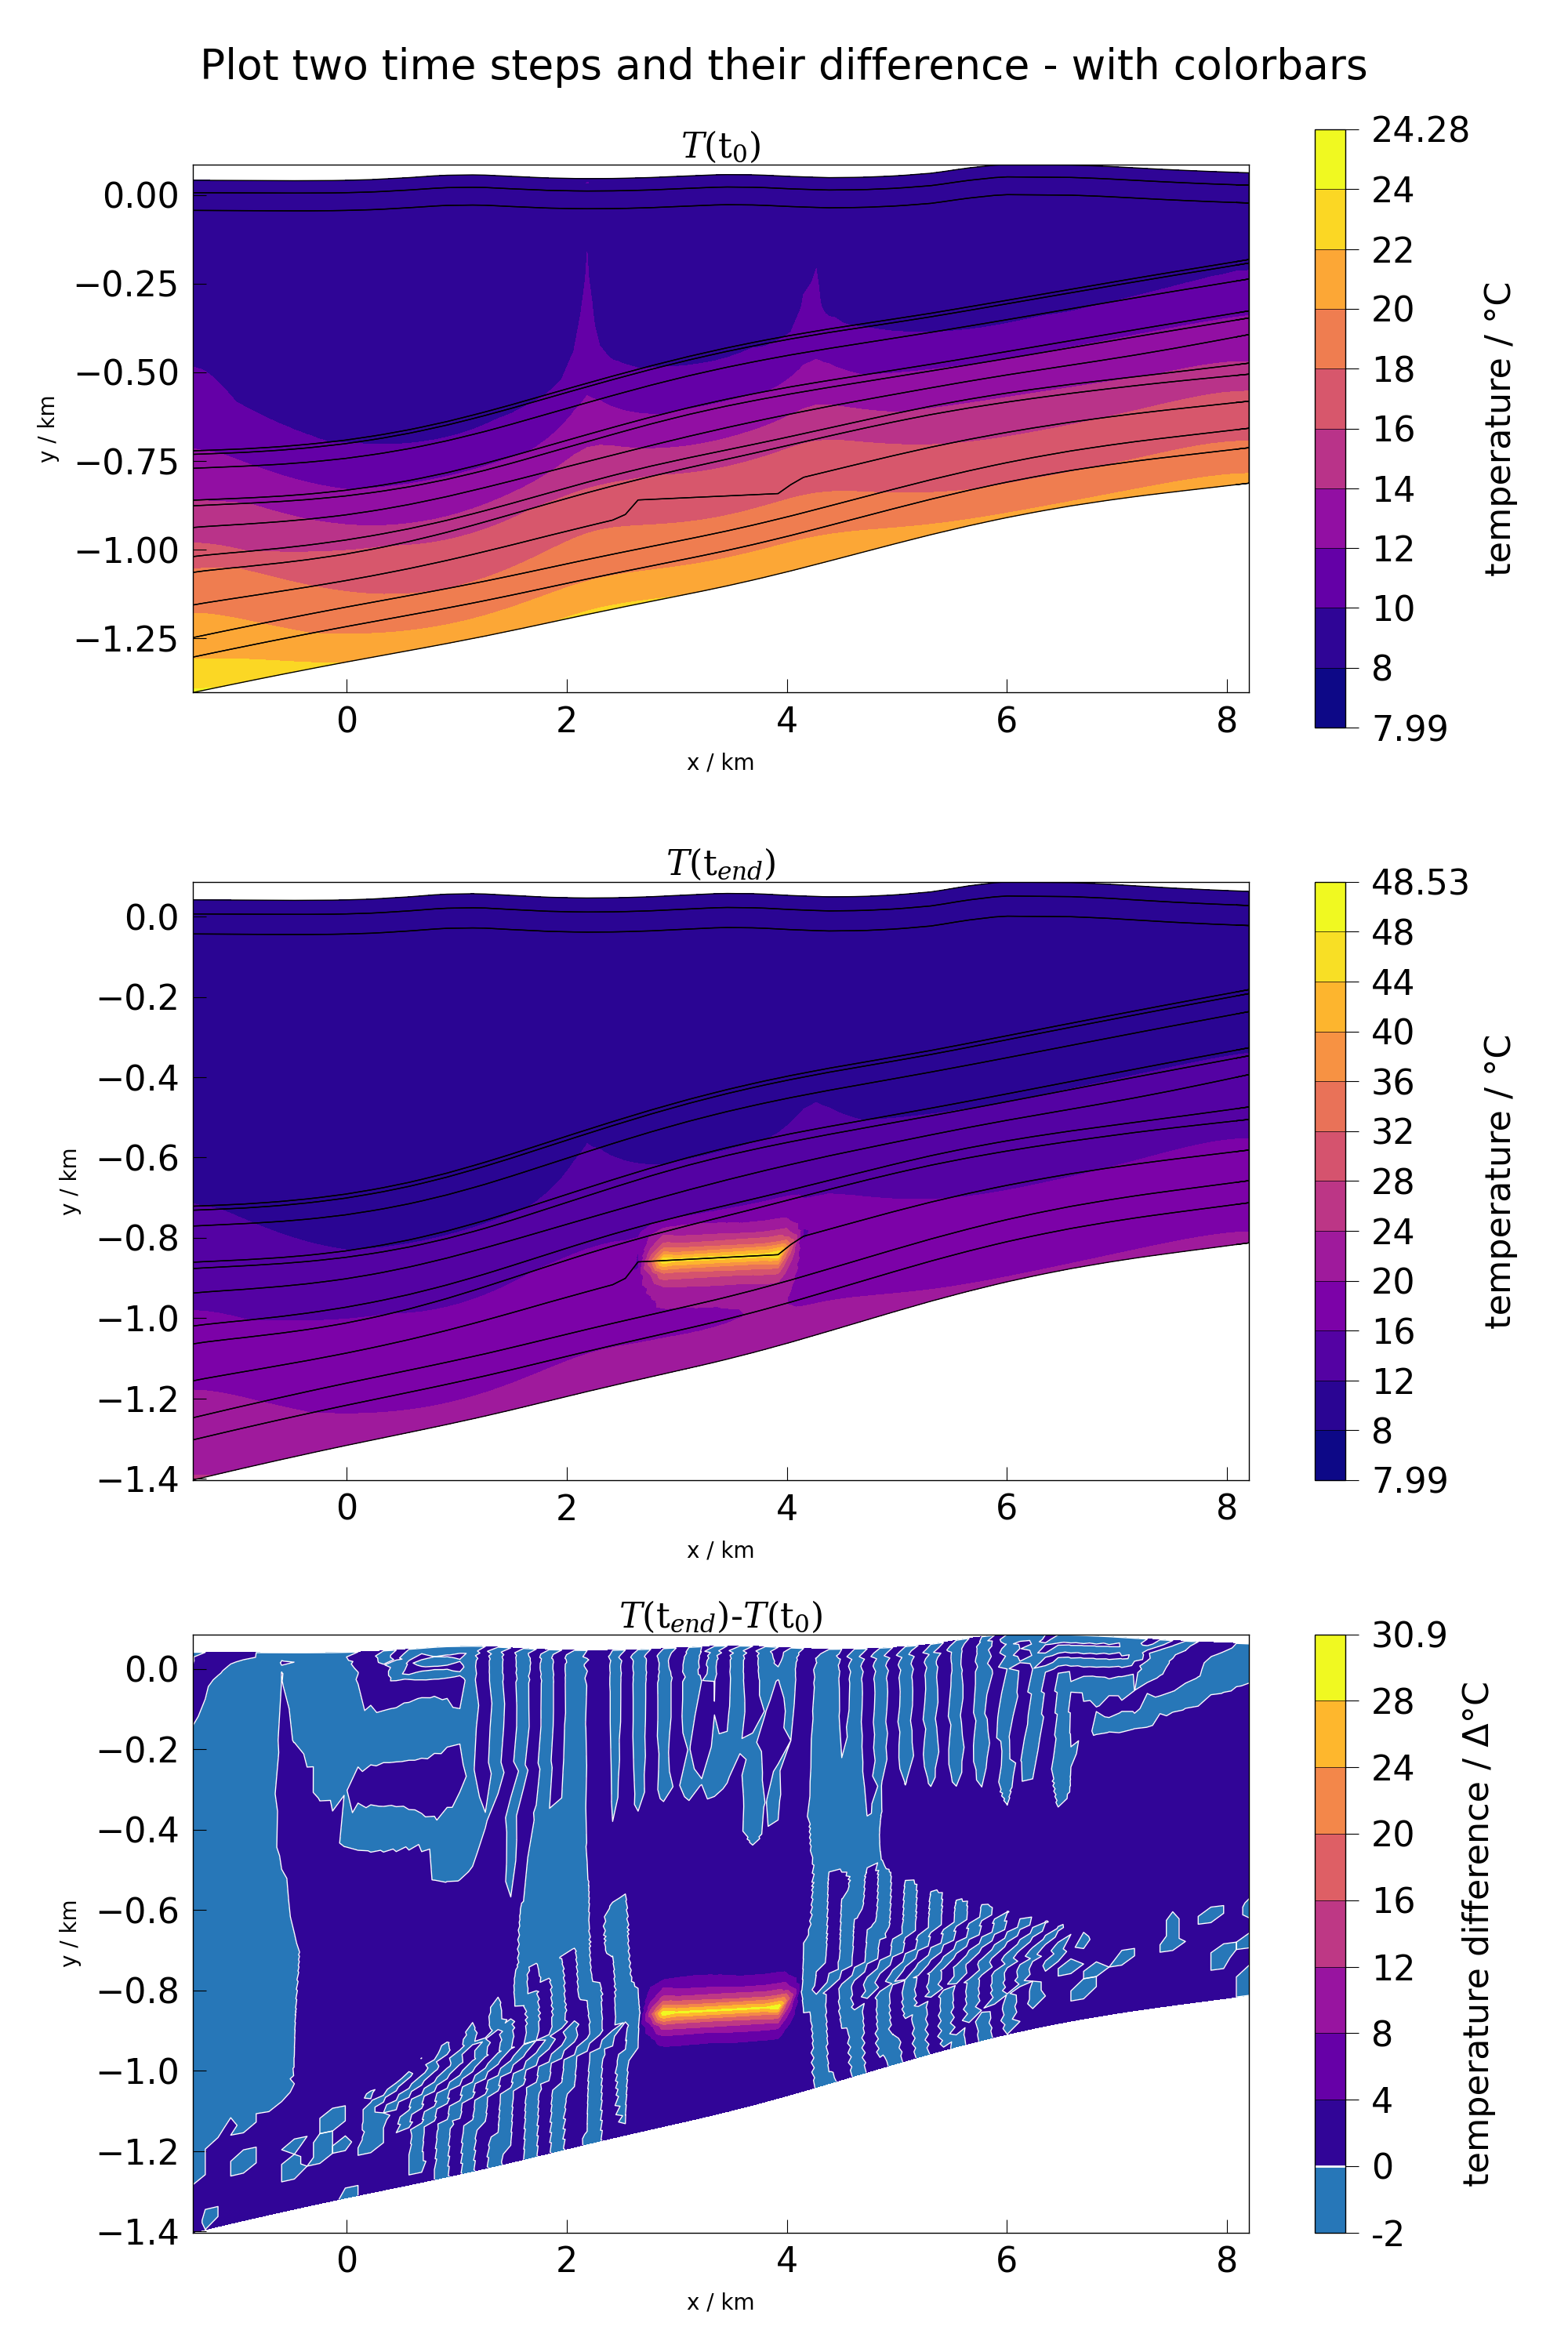
The same way difference between process variables at different time steps can be plotted. Color bars can be drawn automatically, if user provides both Figure and Axes objects:
fig, ax = plt.subplots(3, 1, figsize=(20, 30))
plot(meshseries.read(0), properties.temperature, fig=fig, ax=ax[0])
ax[0].set_title(r"$T(\mathrm{t}_{0})$")
plot(meshseries.read(1), properties.temperature, fig=fig, ax=ax[1])
ax[1].set_title(r"$T(\mathrm{t}_{end})$")
diff_mesh = difference(
    meshseries.read(1), meshseries.read(0), properties.temperature
)
plot(diff_mesh, properties.temperature, fig=fig, ax=ax[2])
ax[2].set_title(r"$T(\mathrm{t}_{end})$-$T(\mathrm{t}_{0})$")
fig.suptitle("Plot two time steps and their difference - with colorbars")
fig.tight_layout()

Total running time of the script: (0 minutes 2.654 seconds)
