Examples#
How to use feflowlib#
Section author: Julian Heinze (Helmholtz Centre for Environmental Research GmbH - UFZ)
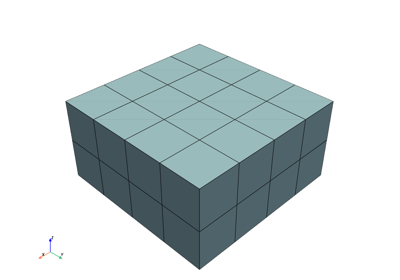
The following shows a brief example of how the feflowlib can be used.
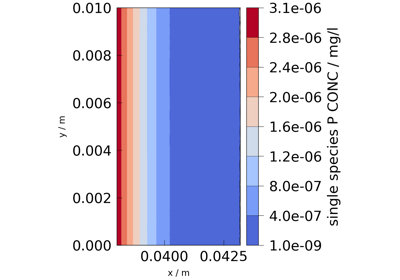
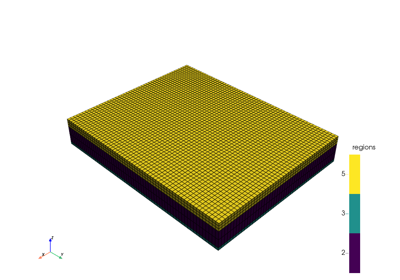
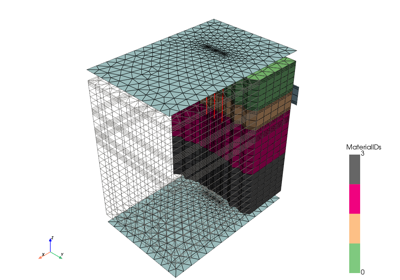
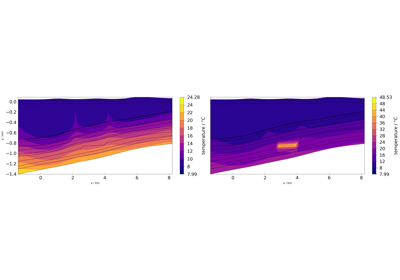
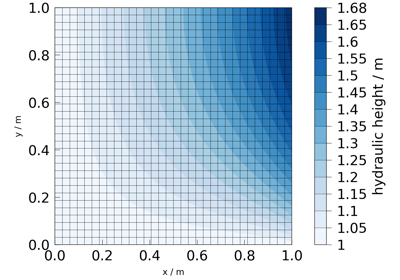
Component-transport model - conversion and simulation
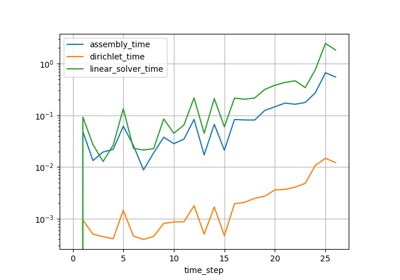
How to use logparser#
Section author: Tobias Meisel (Helmholtz Centre for Environmental Research GmbH - UFZ)
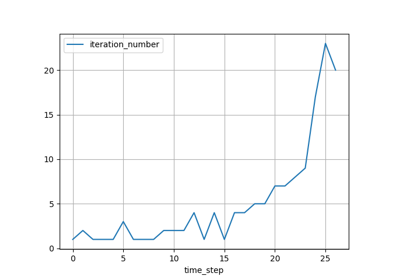
The following jupyter notebooks provide some examples of how to use the logparser.
How to use meshlib#
Section author: Tobias Meisel (Helmholtz Centre for Environmental Research GmbH - UFZ)
The following jupyter notebooks provide some examples of how to use meshlib.
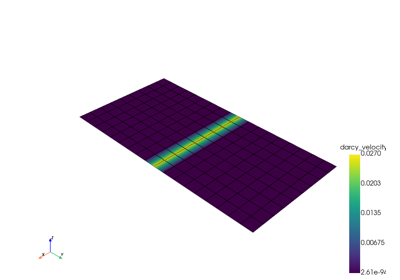
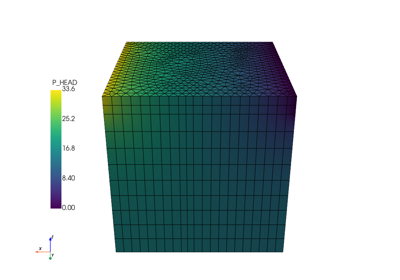
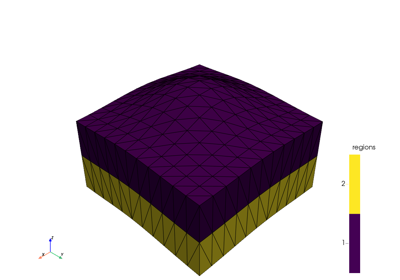
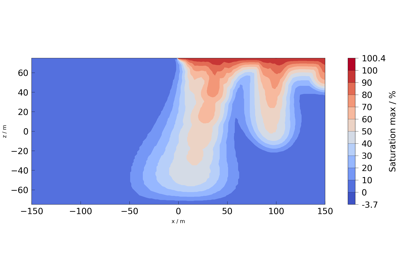
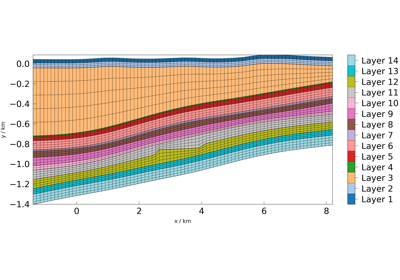
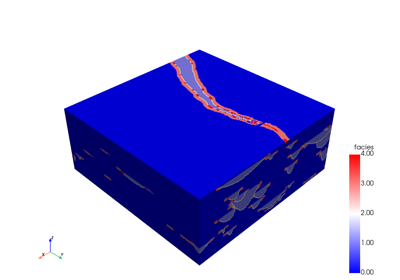
Read mesh from file (vtu or xdmf) into pyvista mesh
How to use meshplotlib#
Section author: Florian Zill (Helmholtz Centre for Environmental Research GmbH - UFZ)
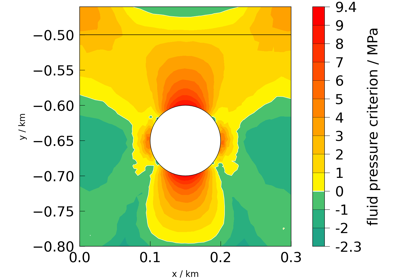
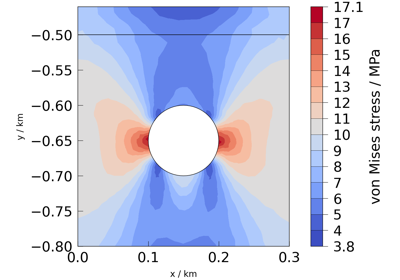
The following jupyter notebooks provide some examples of how to use meshplotlib.
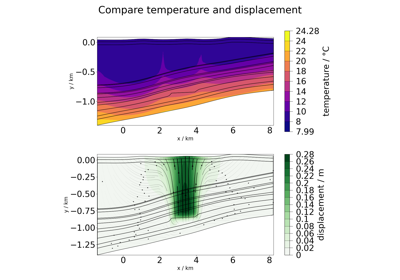
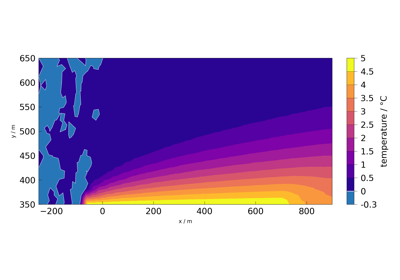
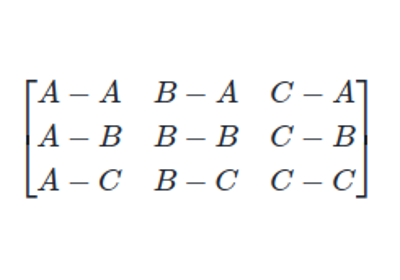
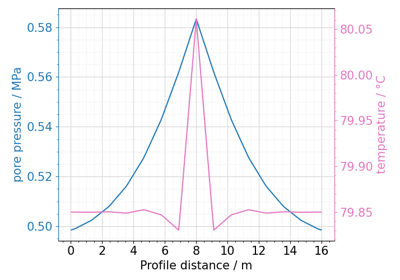
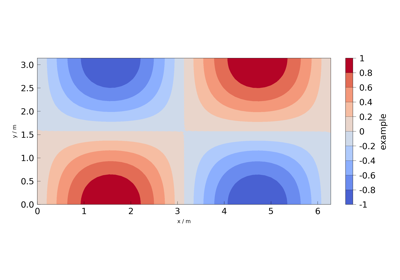
Plotting different process variables on already existing Matplotlib figures / axes
Using proxy models for nuclear waste heat production#
Section author: Florian Zill (Helmholtz Centre for Environmental Research GmbH - UFZ)
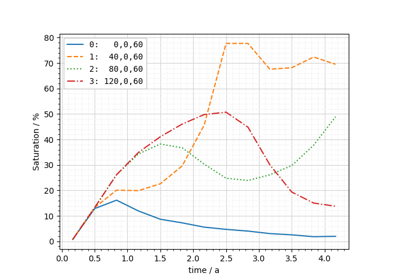
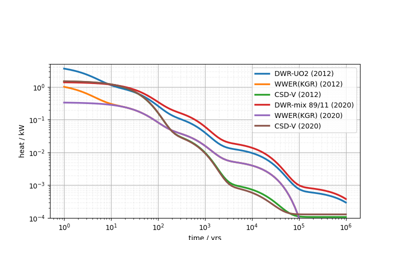
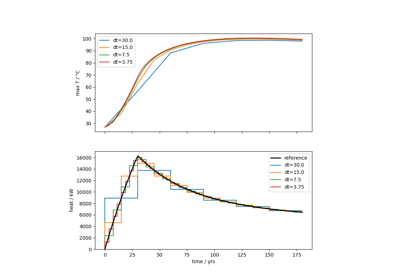
The following jupyter notebook shows some example usage of the `nuclearwasteheat` submodule.
In the context of OGS, this submodule is meant to provide an easy way to calculate
the heat generated by nuclear waste repositories, to apply it in a simulation as
the source term for the temperature process variable.
Features of propertylib#
Section author: Florian Zill (Helmholtz Centre for Environmental Research GmbH - UFZ)
The following jupyter notebook shows some example usage of the propertylib submodule.
Features of studies#
Section author: Florian Zill, Tobias Meisel (Helmholtz Centre for Environmental Research GmbH - UFZ)
The following jupyter notebook shows some example usage of the studies submodule.

