Note
Go to the end to download the full example code.
Property Presets#
Section author: Florian Zill (Helmholtz Centre for Environmental Research GmbH - UFZ)
ogstools.propertylib provides classes (Scalar, Vector, Matrix) which
encapsulate unit handling and data transformation for simplified processing of
mesh data. There are several predefined properties stored under the module
ogstools.propertylib.properties.
from ogstools import examples
from ogstools.meshplotlib import plot
from ogstools.propertylib import Scalar, properties

properties.get_dataframe()
Scalar, Vector and Matrix inherit from the class Property with its
transform() function.
This function converts the argument from data_unit to output_unit and
applies a function if specified. In this case we convert from K to °C:
properties.temperature.transform(273.15)
0.0
You can also create your own properties by creating a Scalar, Vector or Matrix property. The following doesn’t do any unit conversion.
custom_temperature = Scalar(
    data_name="temperature", data_unit="K", output_unit="K"
)
custom_temperature.transform(273.15)
array(273.15)
Or use existing presets as a template and replace some parameters:
custom_temperature = properties.temperature.replace(output_unit="°F")
custom_temperature.transform(273.15)
31.999999999999936
Components of Vector properties and Matrix properties can be accessed with
bracket indexing. Vector properties
should be of length 2 or 3 corresponding to the dimension.
Matrix properties likewise should be of
length 4 [xx, yy, zz, xy] or 6 [xx, yy, zz, xy, yz, xz].
properties.displacement[1].transform([0.01, 0.02, 0.03])
array(0.02)
properties.strain["xx"].transform([0.01, 0.02, 0.03, 0.04, 0.05, 0.06])
1.0
Magnitude of a 2D displacement vector:
properties.displacement.magnitude.transform([0.03, 0.04])
0.05
We suggest specifying the properties and their transformations once.
These can be reused in different kind of post processing. When plotting
with ogstools.meshplotlib we can use these presets to simplify the
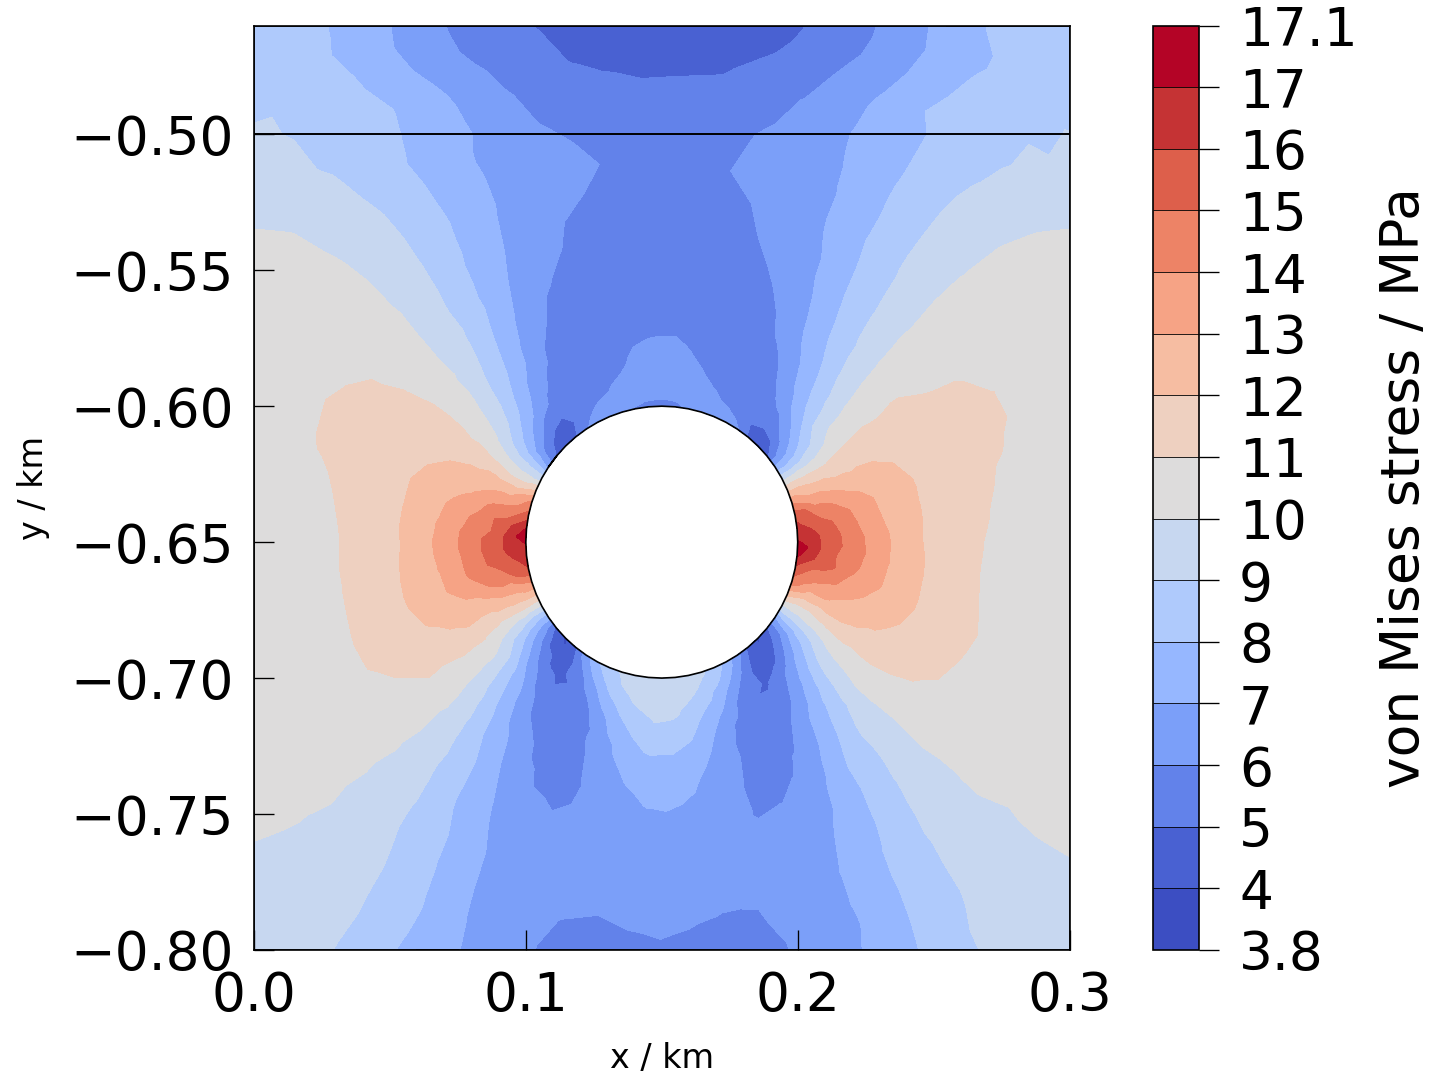
task of processing the data (e.g. calculate the von Mises stress):
fig = plot(examples.load_mesh_mechanics_2D(), properties.stress.von_Mises)

Have a look at How to use meshplotlib for more examples.
Total running time of the script: (0 minutes 0.392 seconds)
