

Plotting the data#
The following jupyter notebooks provide some examples of how to use ogstools to create all different kinds of plots.
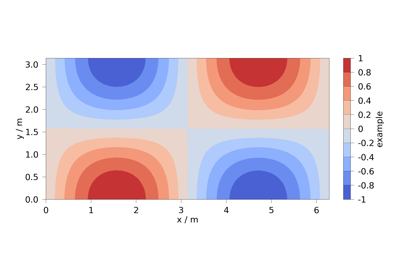
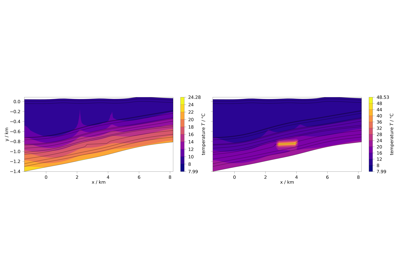
Plotting different process variables on already existing Matplotlib figures / axes
Plotting different process variables on already existing Matplotlib figures / axes