Note
Go to the end to download the full example code.
Feflowlib: How to work with FEFLOW data in pyvista.#
Section author: Julian Heinze (Helmholtz Centre for Environmental Research GmbH - UFZ)
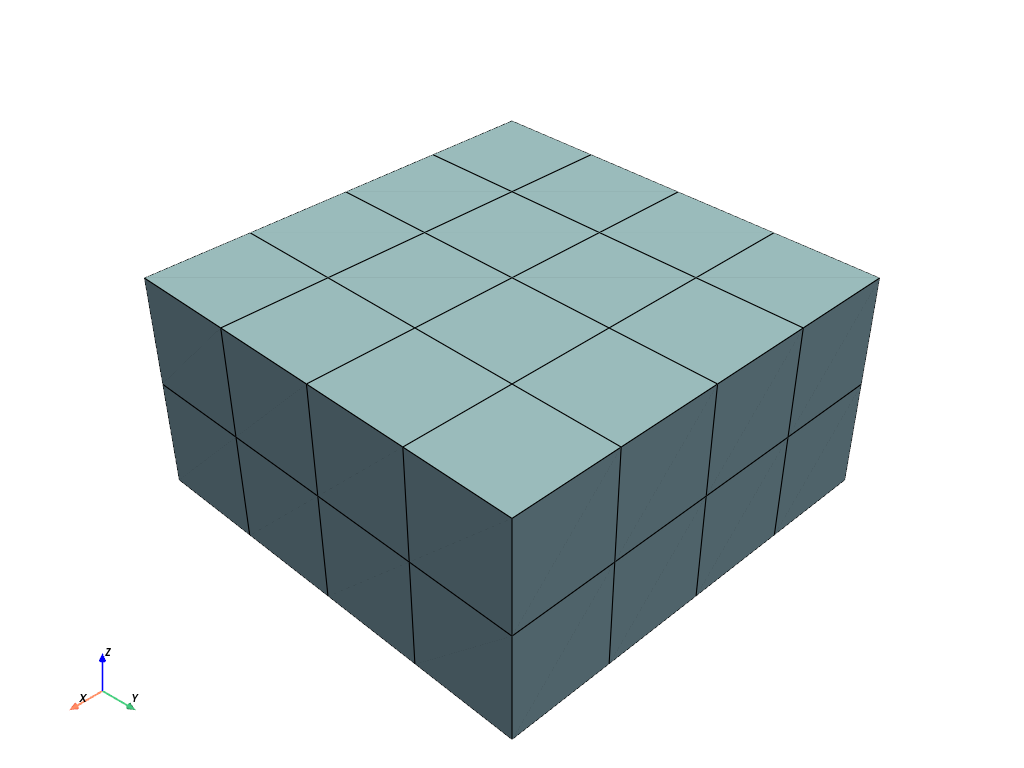
In this example we show how a simple FEFLOW model consisting of two layers can be converted to a pyvista.UnstructuredGrid.
Let us convert only the points and cells at first.
import ifm_contrib as ifm

import ogstools as ogs
from ogstools.examples import feflow_model_2layers
from ogstools.feflowlib import (
    convert_geometry_mesh,
    update_geometry,
)

# Load a FEFLOW model (.fem) or FEFLOW results file (.dac) as a FEFLOW document.
feflow_model = ifm.loadDocument(str(feflow_model_2layers))
pv_mesh = convert_geometry_mesh(feflow_model)
pv_mesh.plot(show_edges=True, off_screen=True)

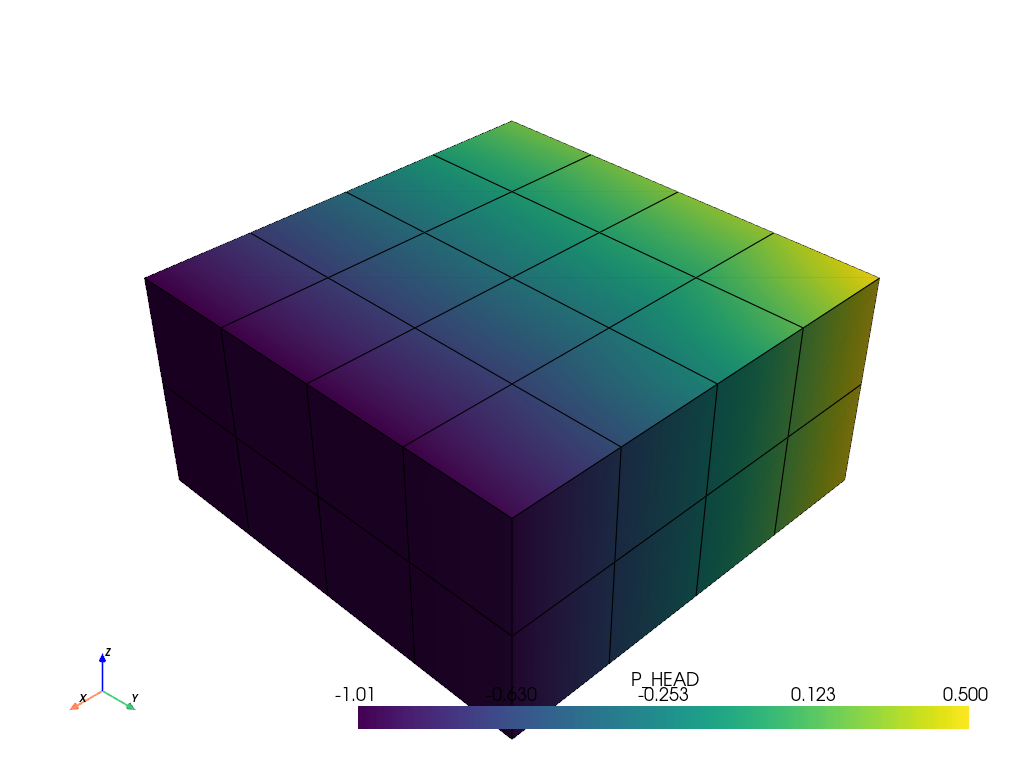
To this mesh we add point and cell data.
pv_mesh = update_geometry(pv_mesh, feflow_model)
pv_mesh.plot(scalars="P_HEAD", show_edges=True, off_screen=True)
# Print information about the mesh.
print(pv_mesh)

UnstructuredGrid (0x7cd485b01300)
  N Cells:    32
  N Points:   75
  X Bounds:   3.000e+01, 7.000e+01
  Y Bounds:   3.000e+01, 7.000e+01
  Z Bounds:   -2.000e+01, 0.000e+00
  N Arrays:   22
3. As the FEFLOW data now are a pyvista.UnstructuredGrid, all pyvista functionalities can be applied to it.
Further information can be found at https://docs.pyvista.org/version/stable/user-guide/simple.html.
For example it can be saved as a VTK Unstructured Grid File (*.vtu).
This allows to use the FEFLOW model for OGS simulation or to observe it in Paraview`.
pv_mesh.save("2layers_model.vtu")
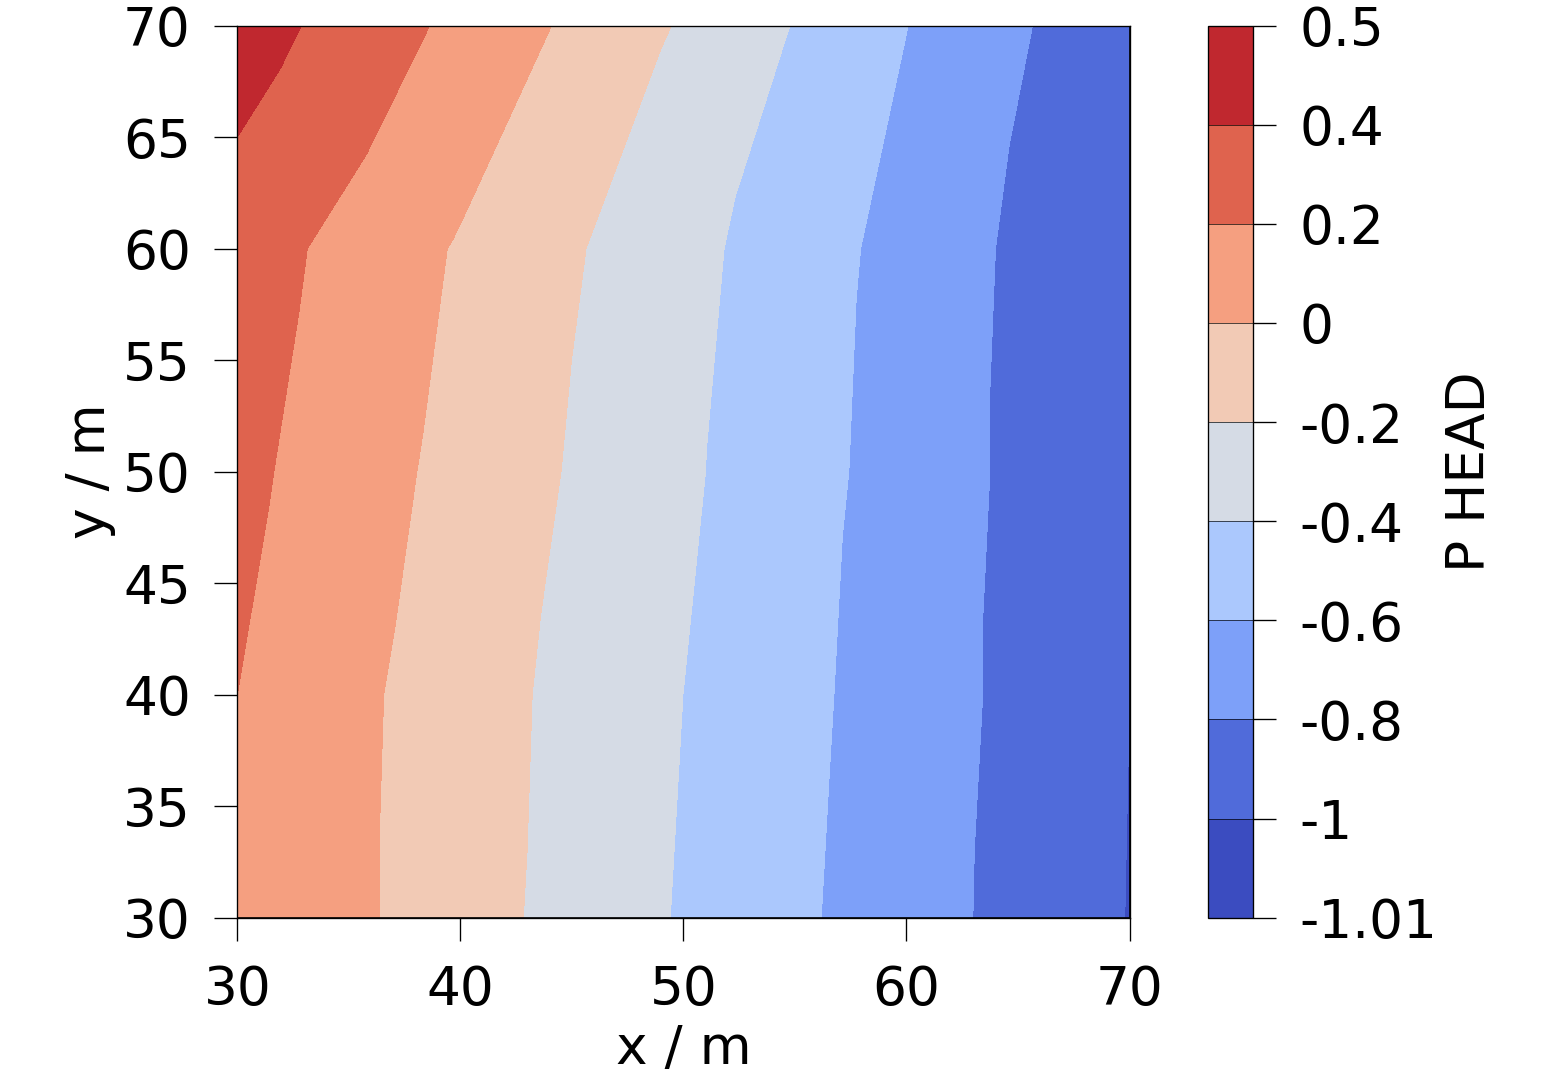
Use the ogstools plotting functionalities.
fig = ogs.plot.contourf(pv_mesh.slice("z"), "P_HEAD")

Total running time of the script: (0 minutes 0.675 seconds)
