

Note
Go to the end to download the full example code or to run this example in your browser via Binder.
Plot data of a sampling lines#
This example provides clean coding recipes for plotting data of meshes over
sampling lines. We also present different ways to setup the sampling lines.
For plotting we us the function ogstools.plot.line().
from itertools import pairwise

import matplotlib.pyplot as plt
import numpy as np
import pyvista as pv

import ogstools as ot
from ogstools import examples

ot.plot.setup.show_region_bounds = False
mesh = examples.load_mesh_mechanics_2D()
Simple case: straight line#
We use the pyvista function sample_over_line and use two points to
define the line and get a Mesh with the sampled data. Let’s plot the Mesh and
the line together.
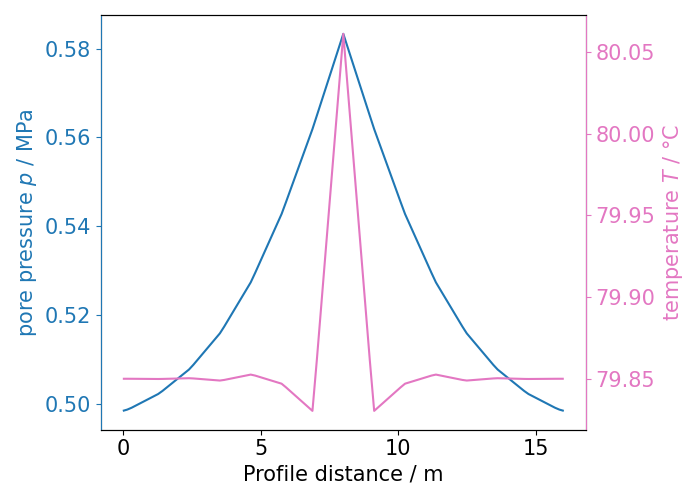
Now we plot the temperature data. The spatial coordinate for the x-axis is automatically detected here.
fig = ot.plot.line(sample, ot.variables.temperature)
fig.tight_layout()
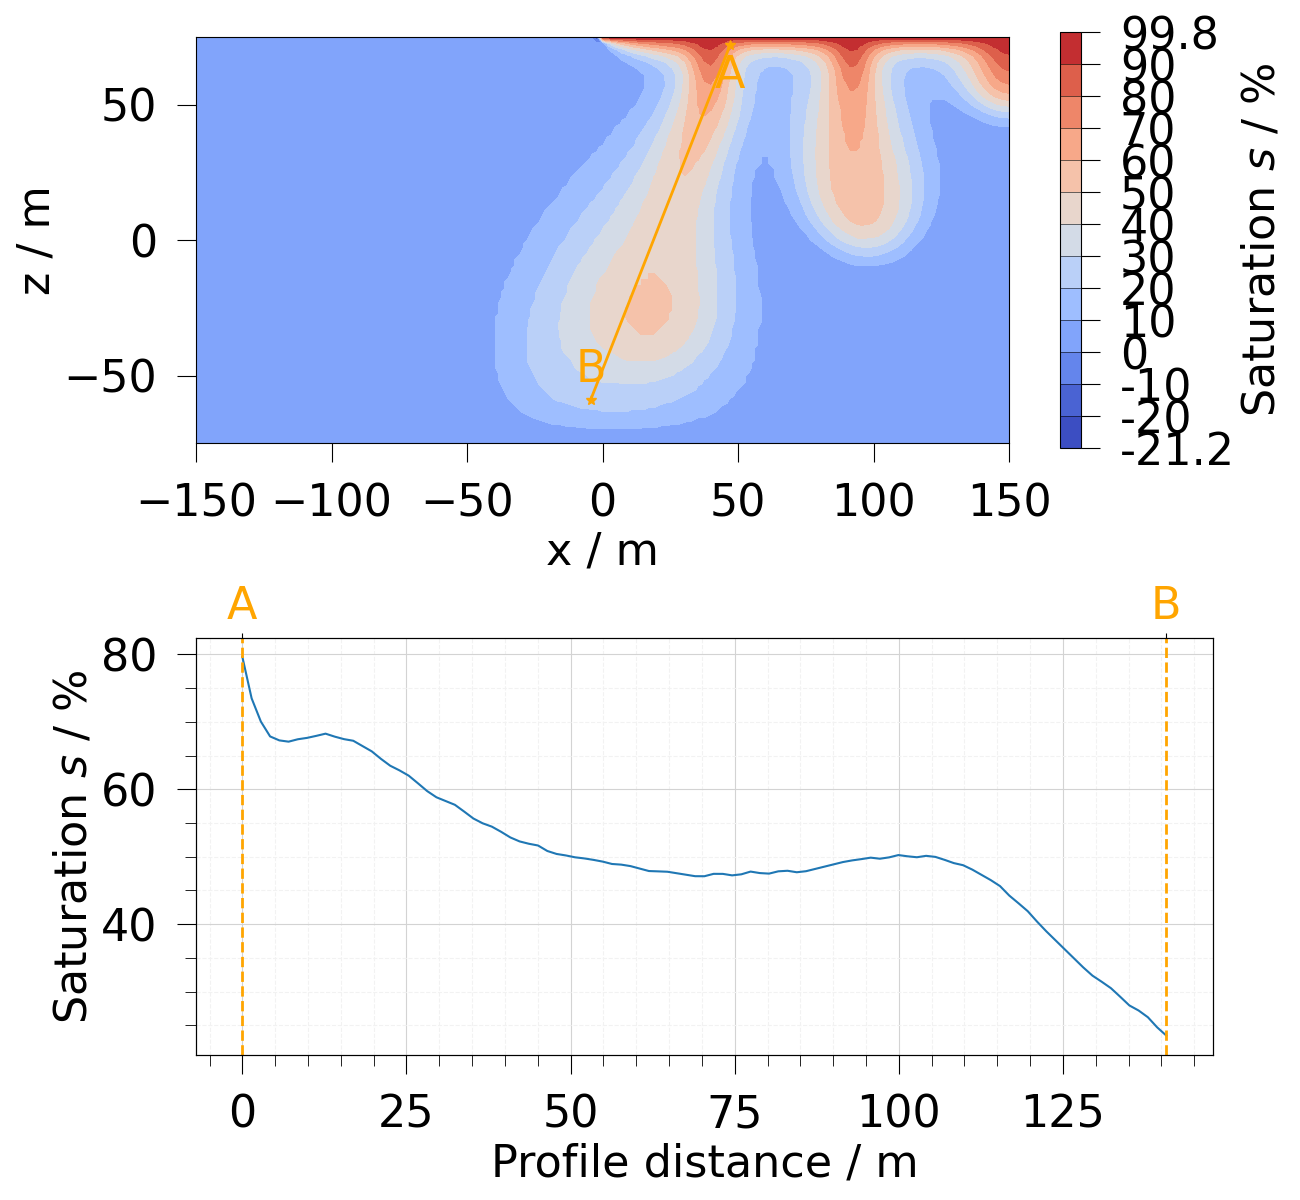
Simple case: circular arc#
With 3 points we can define an arc over which to sample the data. Having the arc directly on a boundary might result in some gaps in the sampled data, thus we extend the arc by a small margin.
sample = mesh.sample_over_circular_arc(
    pointa=[100 - 1e-4, -650, 0],
    pointb=[200 + 1e-4, -650, 0],
    center=[150, -650, 0],
)
fig, axs = plt.subplots(ncols=2, figsize=[26, 10])
ot.plot.contourf(mesh, ot.variables.displacement["x"], fig=fig, ax=axs[1])
ot.plot.line(sample, ax=axs[1], lw=3, color="red")
ot.plot.line(sample, ot.variables.displacement["x"], ax=axs[0])
fig.tight_layout()
Other methods to setup the sampling line#
The following section shows different methods of creating sampling lines.
Linear spaced points#
This basically does the same as the pyvista function sample_over_line.
pts = np.linspace([120, -460, 0], [120, -800, 0], 100)
sample_1 = pv.lines_from_points(pts).sample(mesh)
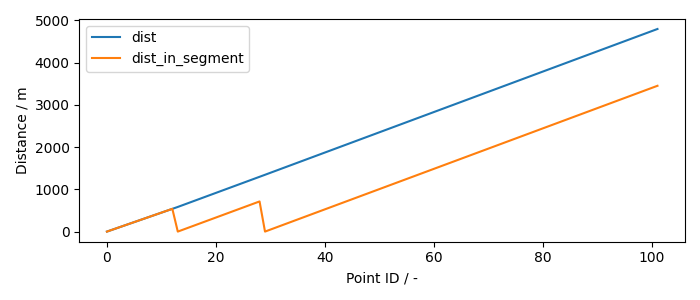
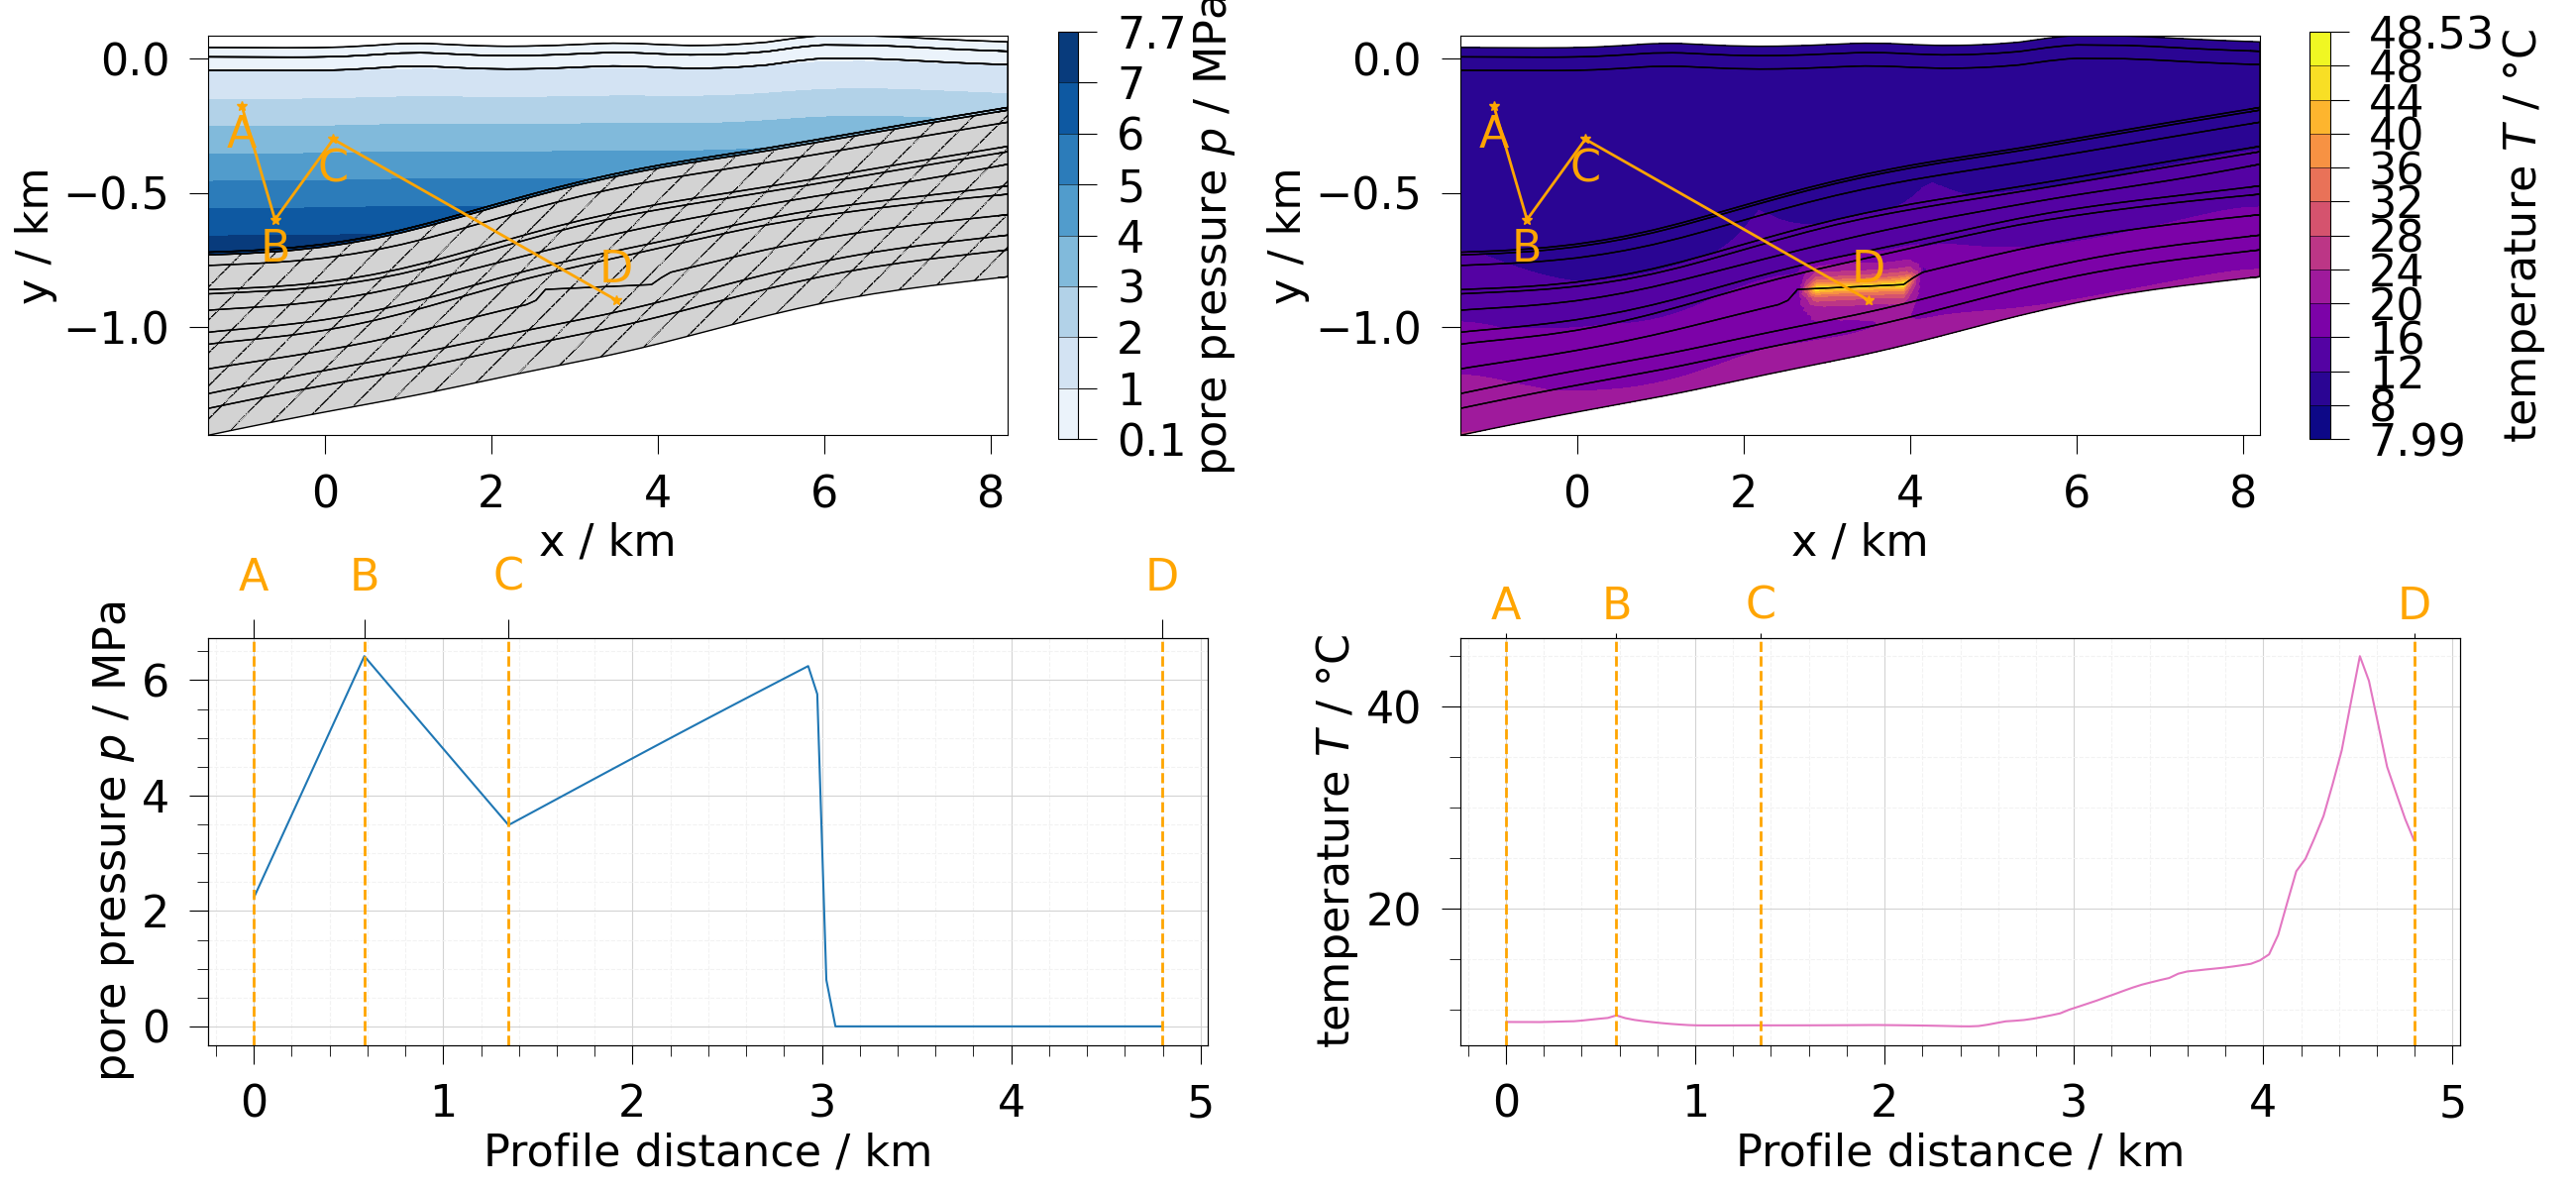
Mutilsegmented line from list of points#
The following code allows you to have a line connecting multiple observation points.
obs_pts = np.asarray([[150, -460, 0], [50, -650, 0], [150, -800, 0]])
pts = np.vstack([np.linspace(pt1, pt2, 50) for pt1, pt2 in pairwise(obs_pts)])
sample_2 = pv.lines_from_points(pts).sample(mesh)
Spline from list of points#
You can also create smooth sampling lines by using a fitting function. The following creates a second order polynomial fit for the x-coordinates in dependence of the y-coordinates.
pts = np.asarray([[200, -460, 0], [250, -650, 0], [200, -800, 0]])
fit = np.poly1d(np.polyfit(pts[:, 1], pts[:, 0], 2))
y = np.linspace(-460, -800, 100)
pts = np.transpose([fit(y), y, y * 0])
sample_3 = pv.lines_from_points(pts).sample(mesh)
Use existing geometry#
Another way to setup the sampling line is to extract points from the domain
mesh. Here, we use the clip function from pyvista and some boolean logic,
to extract a vertical line through the center, which follows the boundary of
the hole.
edges = mesh.clip("x").extract_feature_edges()
is_top_bot = np.isin(edges.points[:, 1], [-800, -460])
is_left = edges.points[:, 0] == 0
pts = edges.points[np.invert(is_top_bot | is_left)]
sample_4 = pv.lines_from_points(pts).sample(mesh)
Now we plot all samples for comparison.
fig, axs = plt.subplots(ncols=2, figsize=[26, 10])
u_x = ot.variables.displacement["x"]
ot.plot.contourf(mesh, u_x, fig=fig, ax=axs[1])
for i, sample in enumerate([sample_1, sample_2, sample_3, sample_4]):
    c = f"C{i}"  # cycle through default color cycle
    ot.plot.line(sample, ax=axs[1], linestyle="--", color=c)
    ot.plot.line(sample, u_x, "y", ax=axs[0], label=f"sample {i + 1}", color=c)
fig.tight_layout()
If you want to sample data over multiple timesteps in a MeshSeries, have a look at How to Create Time Slices.
Total running time of the script: (0 minutes 1.463 seconds)