

Note
Go to the end to download the full example code or to run this example in your browser via Binder.
Visualizing 3D model data#
For visualizing 3D data it might make sense to plot multiple views / slices.
To create them we use pyvista as it provides all the necessary functionality.
If we want to plot multiple meshes, they have to be in a 2D numpy array.
The shape of this array determines the number of rows and columns in our plot.
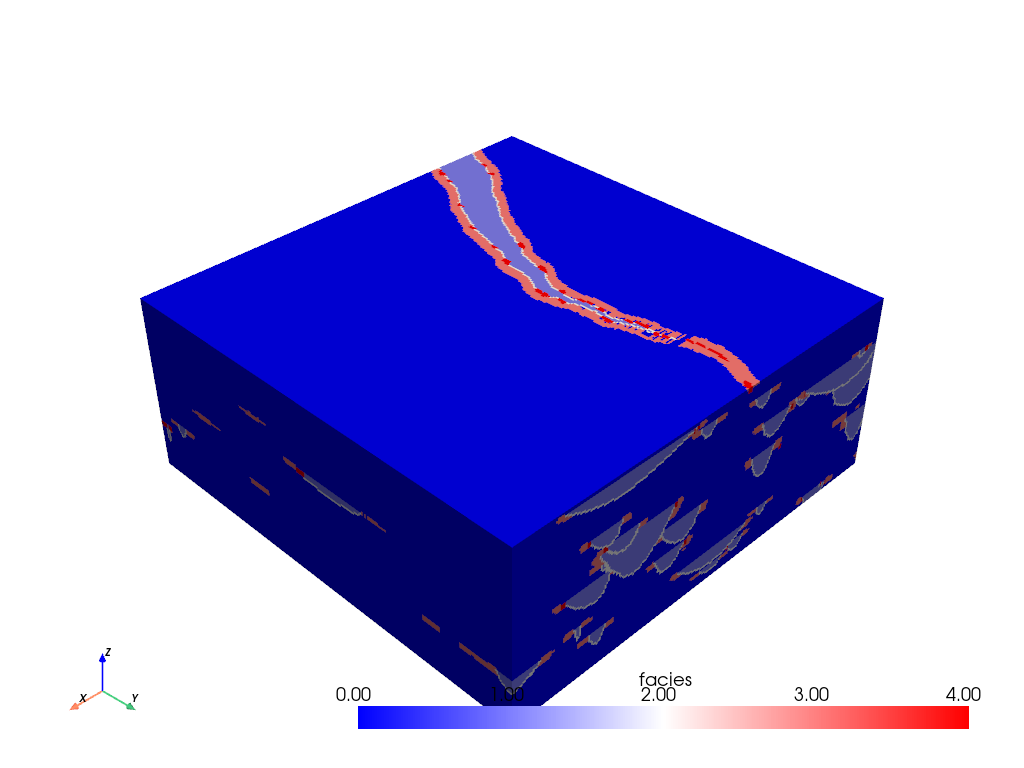
First, let’s load 3D example data from pyvista and plot the only available
data: “facies” with a native pyvista plot.
ot.plot.contourf(
    section, data, show_edges=False, opacities={0: 0.2}, interactive=False
)
# only plotting a part of the example, as using opacities is expensive
# performance-wise and the example is big.
It might make sense to plot multiple views / slices of 3D data.
To create them we use the slicing functions of pyvista.
If we want to plot multiple meshes, they have to be in a 2D numpy array.
The shape of this array determines the number of rows and columns in our plot.
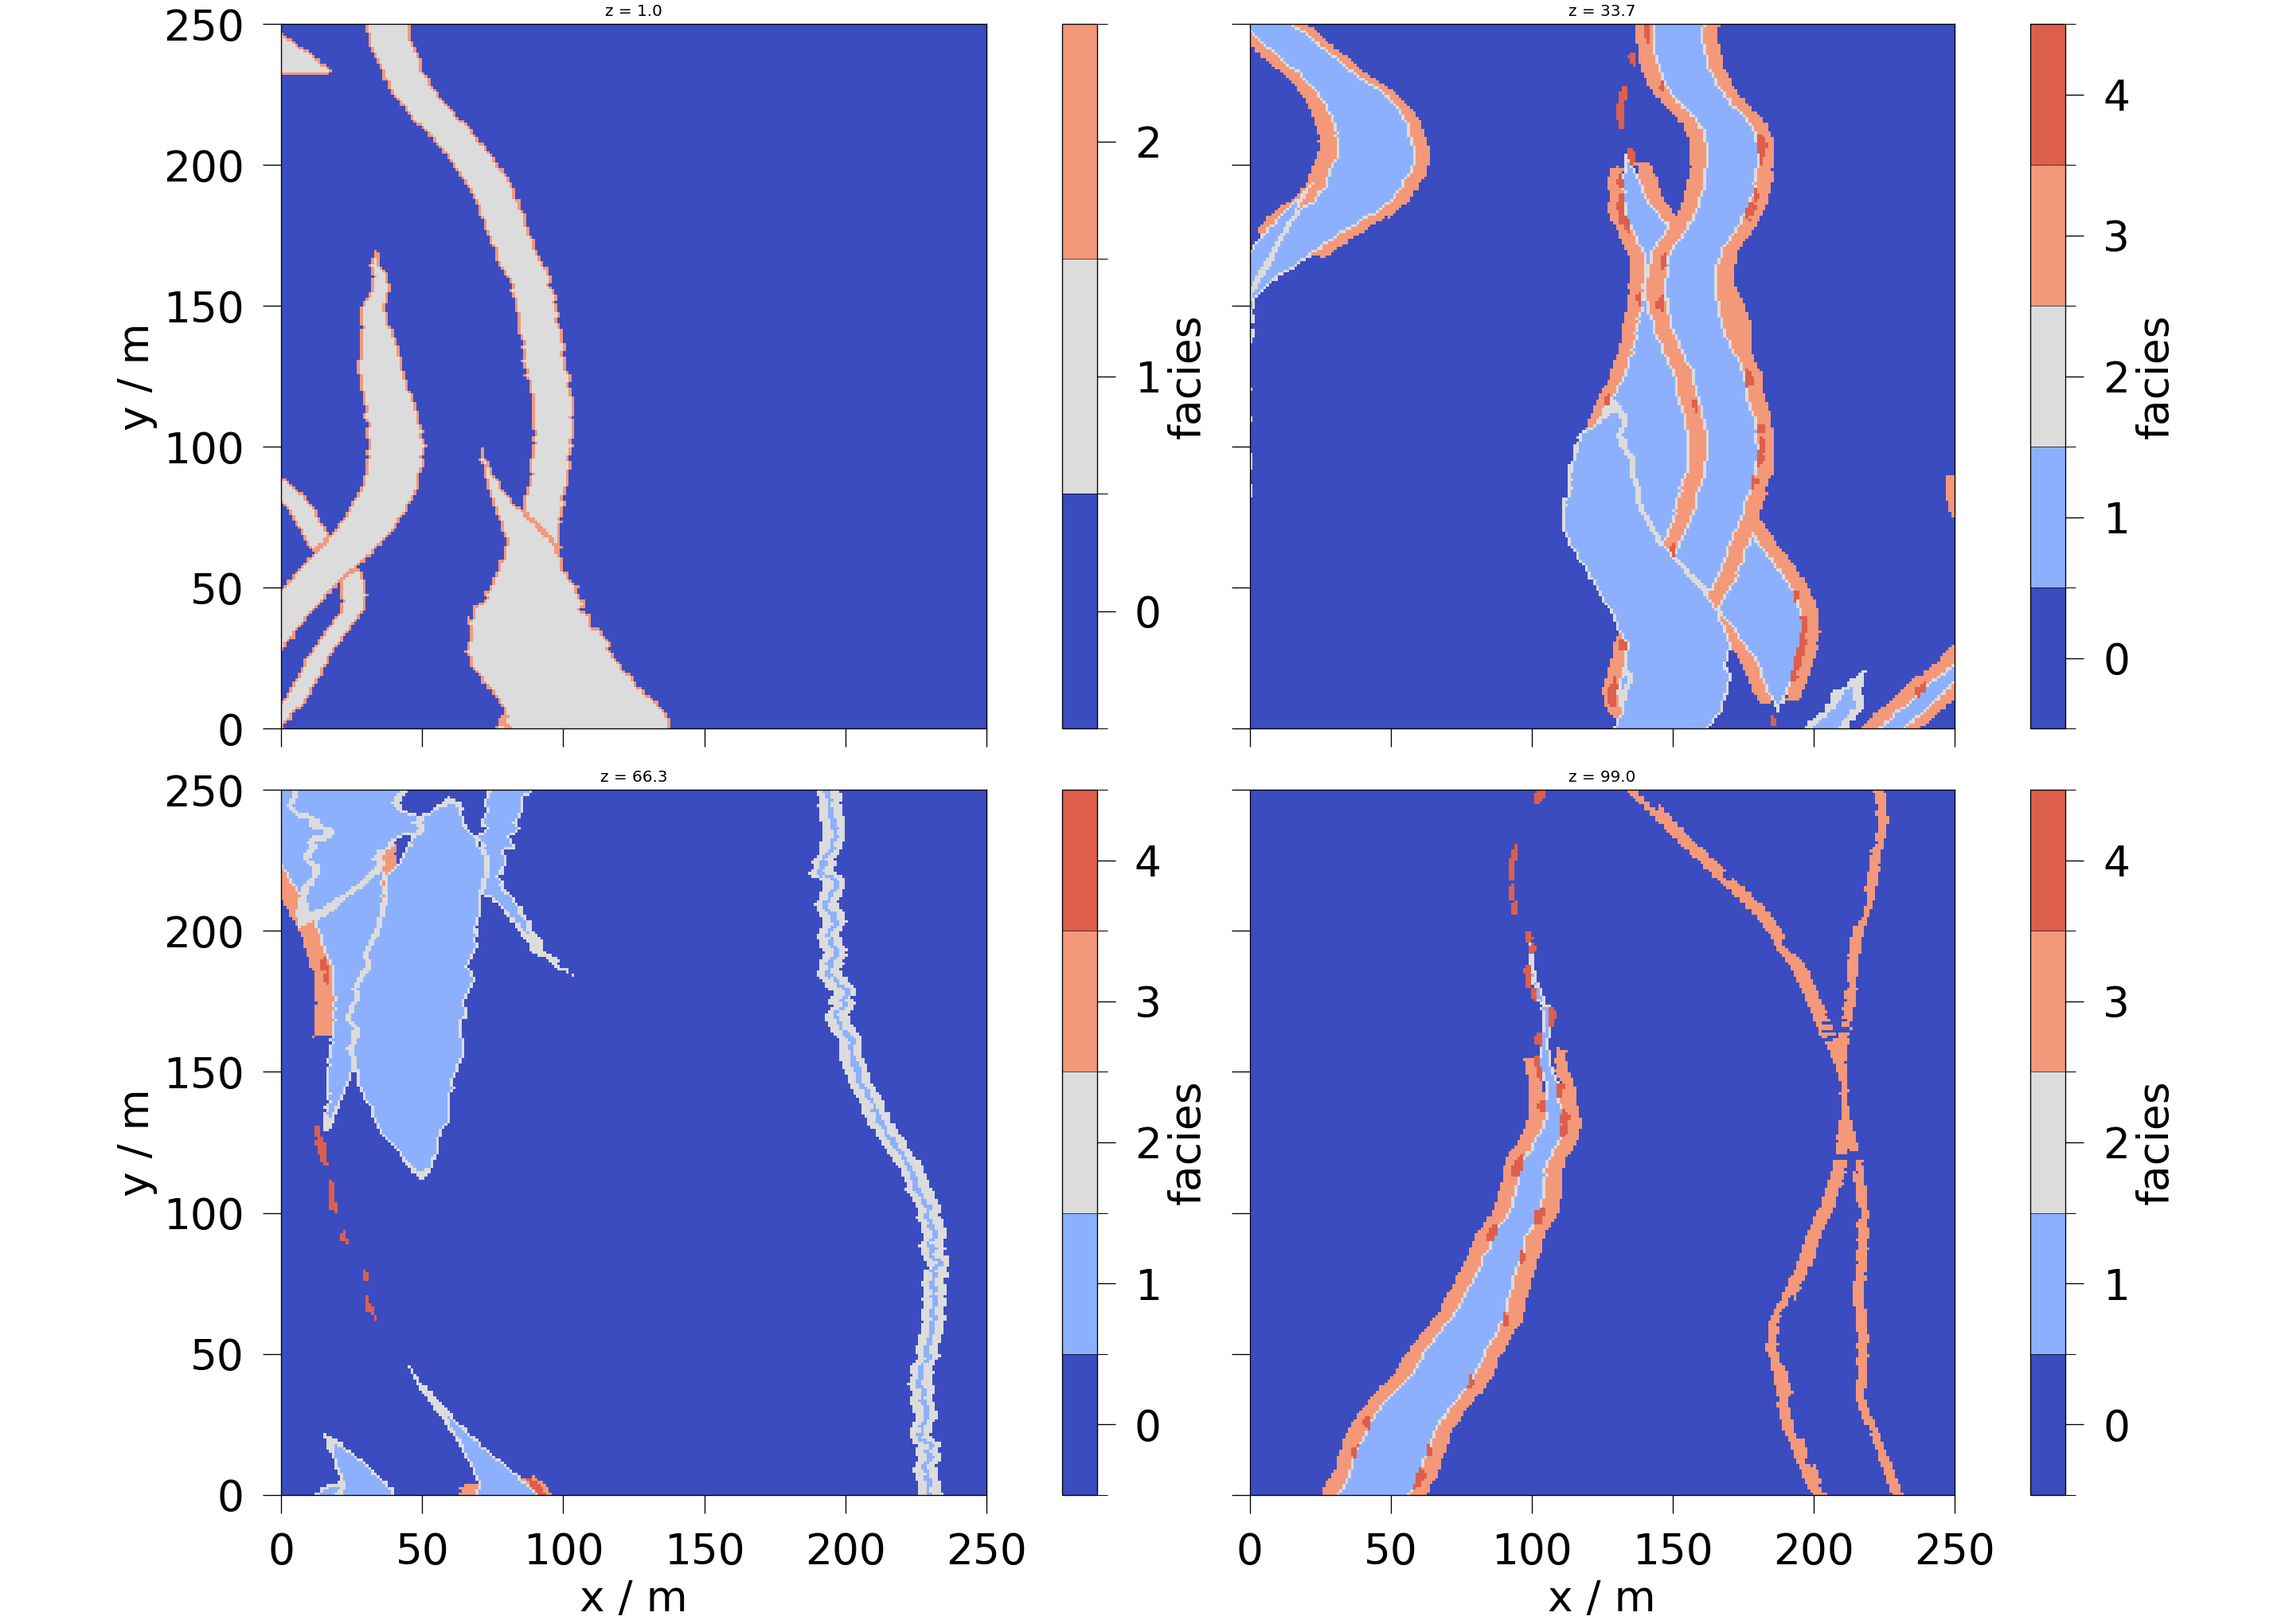
Let’s create multiple slices along the z axis and plot them in a 2 by 2 grid.
slices = np.reshape(list(mesh.slice_along_axis(n=4, axis="z")), (2, 2))
fig = ot.plot.contourf(slices, data, figsize=[8, 6], fontsize=12)
for ax, slice in zip(fig.axes, np.ravel(slices), strict=False):
    ax.set_title(f"z = {slice.center[2]:.1f}")
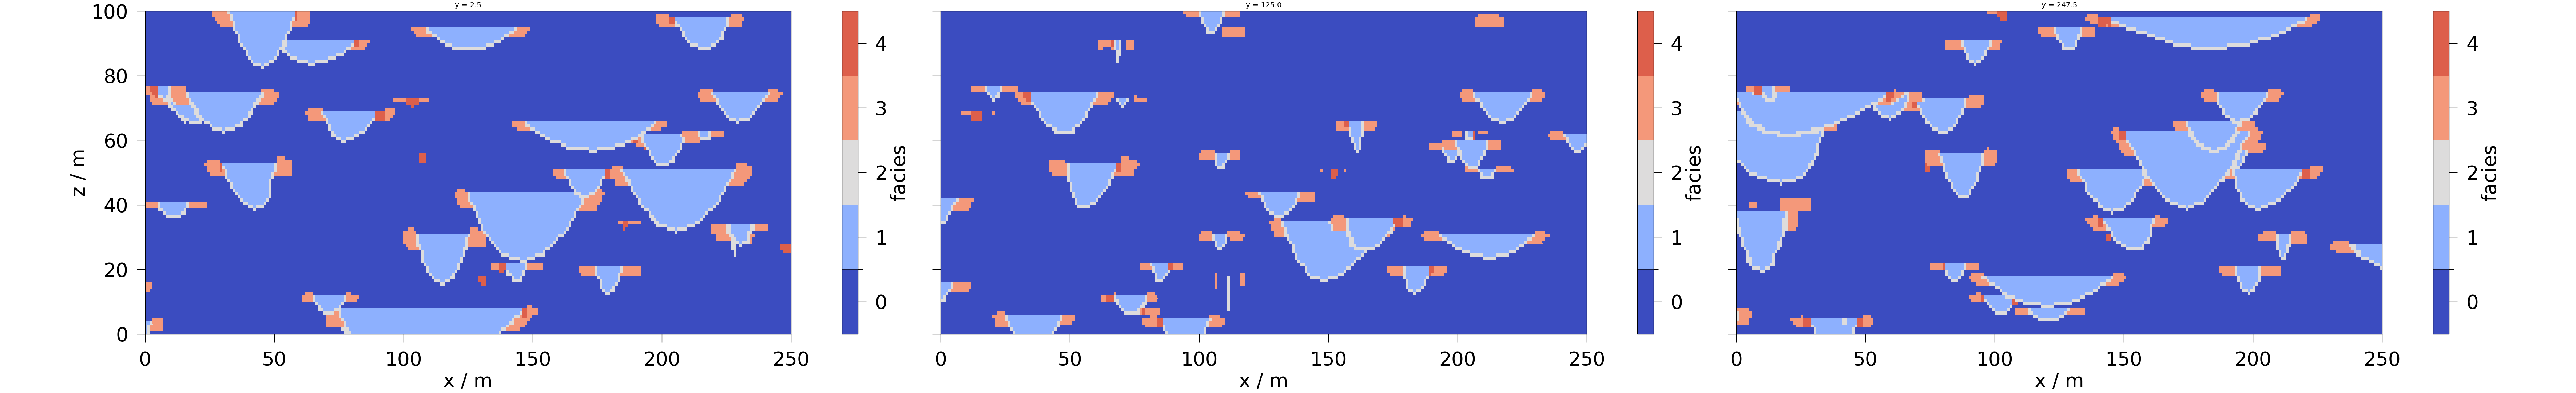
We can also slice along the y-axis and plot the meshes in one row.
slices = np.reshape(mesh.slice_along_axis(n=3, axis="y"), (1, -1))
fig = ot.plot.contourf(slices, data, figsize=[8, 6], fontsize=12)
for ax, slice in zip(fig.axes, np.ravel(slices), strict=False):
    ax.set_title(f"y = {slice.center[1]:.1f}")
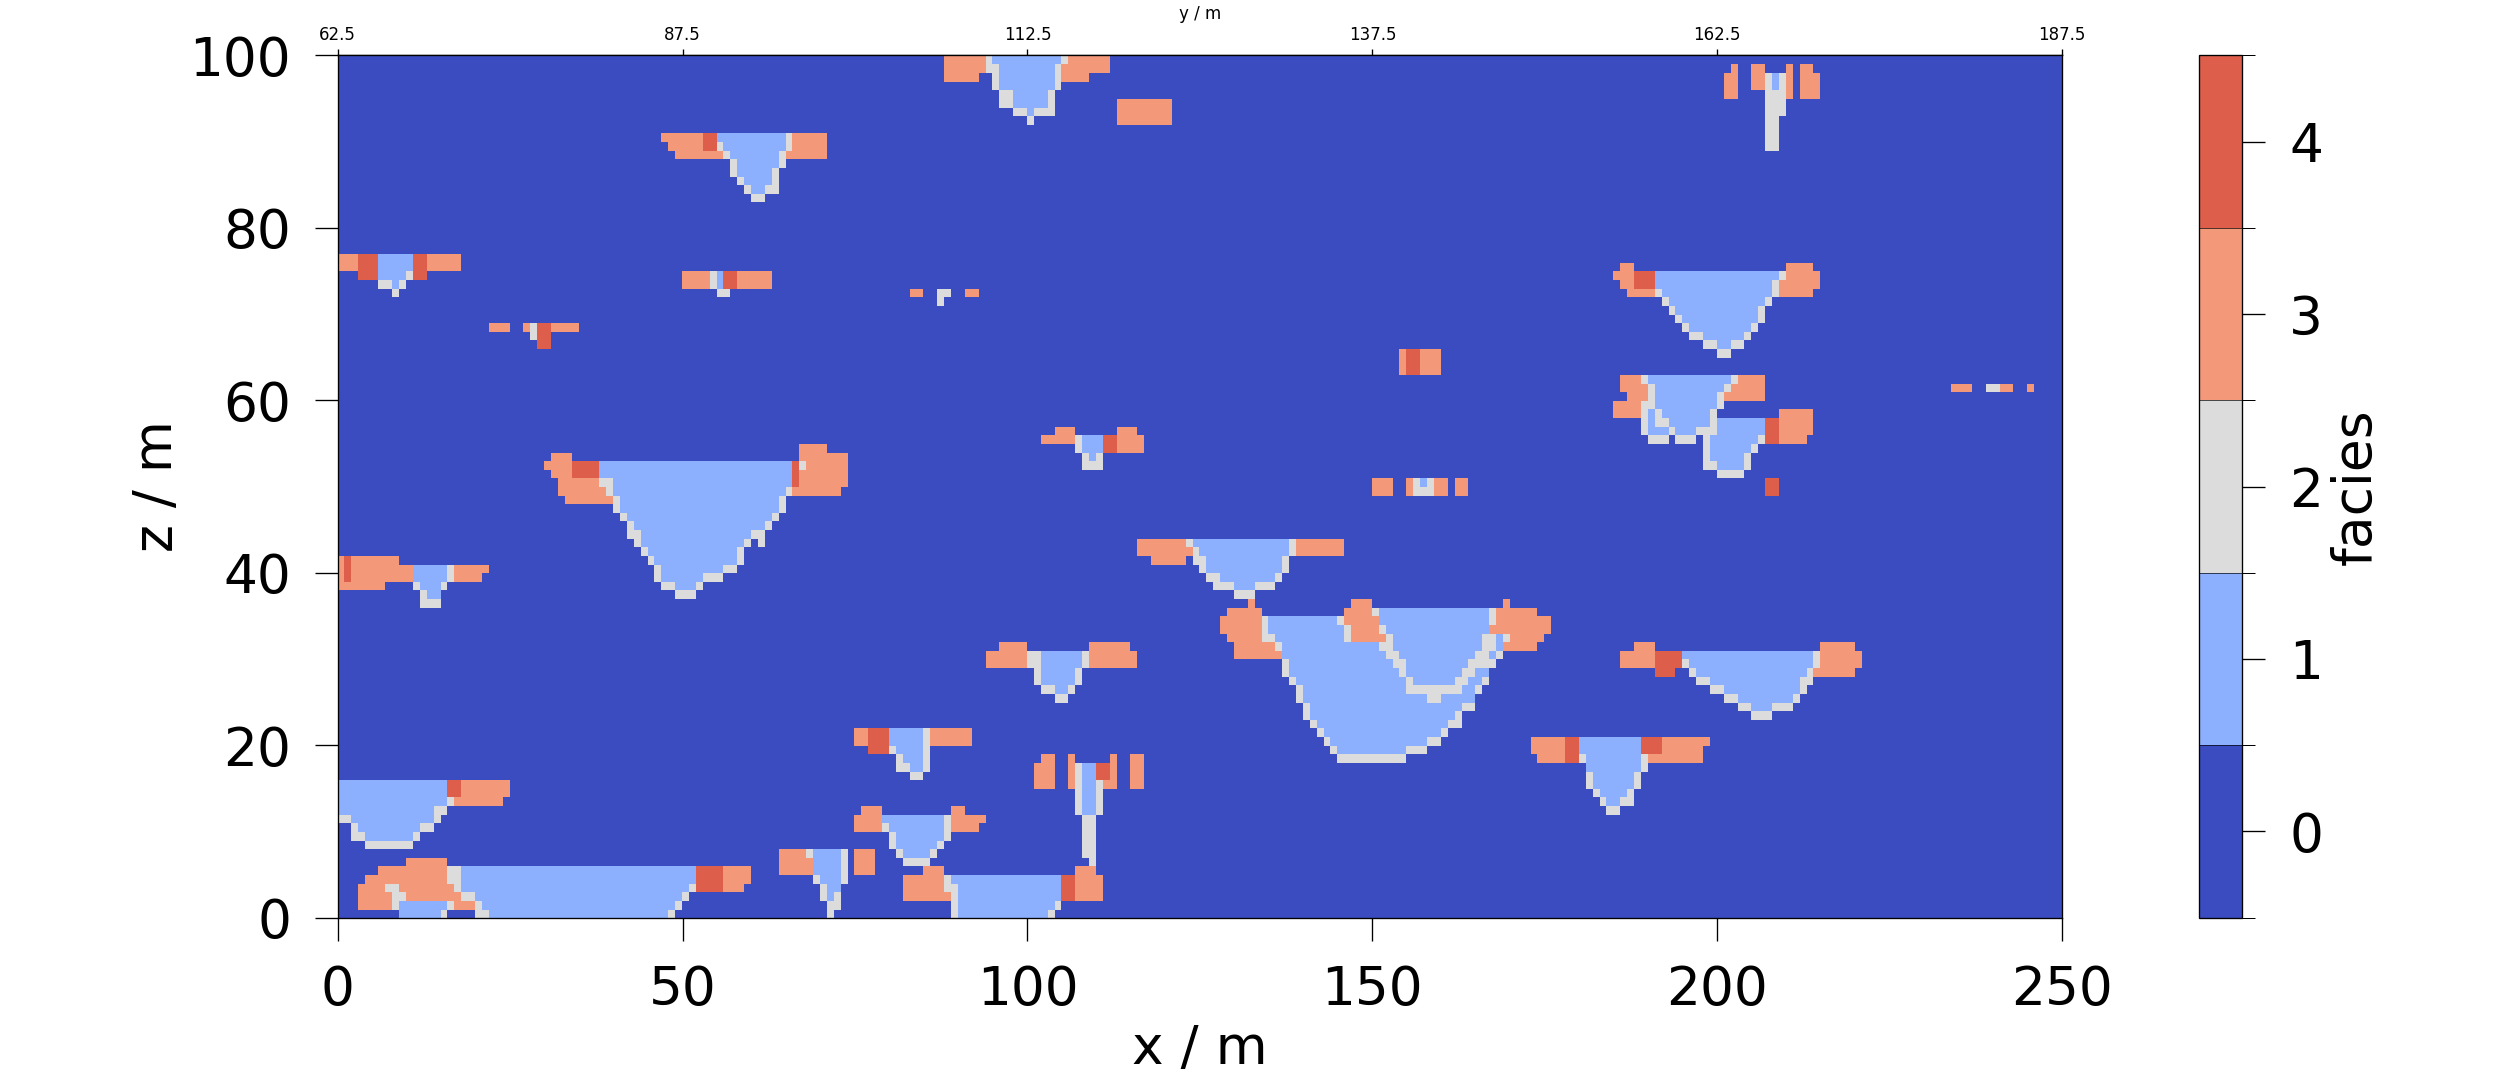
Arbitrary oriented slices are also possible. They get projected to the cardinal plane, from which they have the least rotational offset.
fig = ot.plot.contourf(mesh.slice([1, -2, 0]), data)
Total running time of the script: (0 minutes 9.523 seconds)