

Note
Go to the end to download the full example code or to run this example in your browser via Binder.
Shared axes#
In this example we show how to create filled contourplots on a figure with subplots having shared axes.
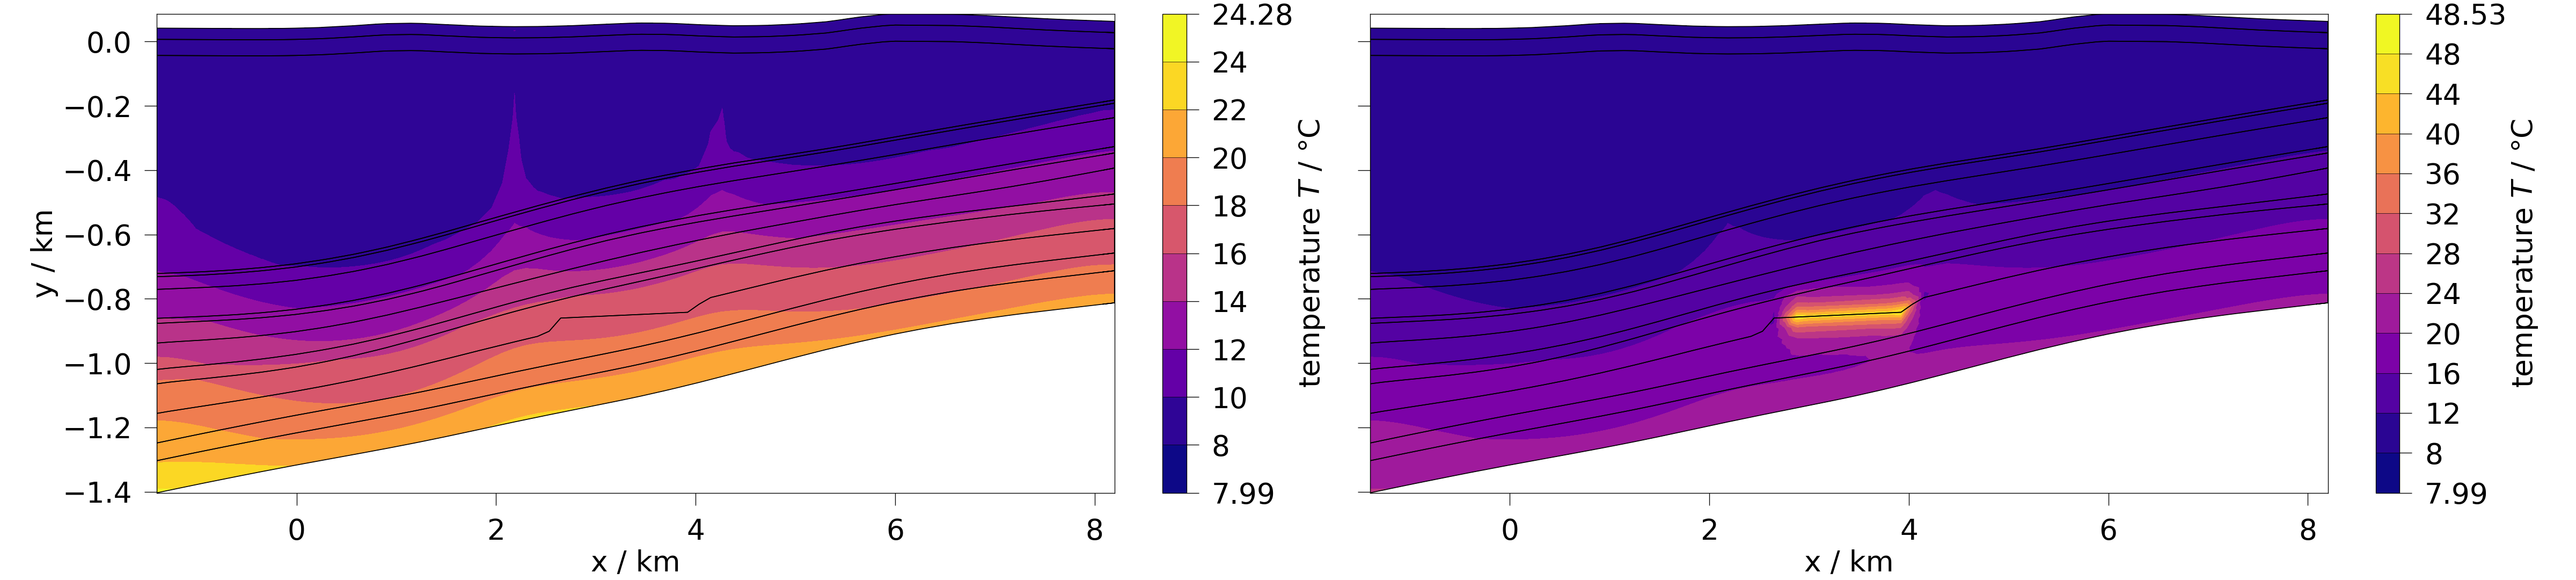
If you pass multiple meshes to ogstools.plot.contourf()
by default both x and y axes will shared. Thus, only the outer axes get
axes labels and tick label.
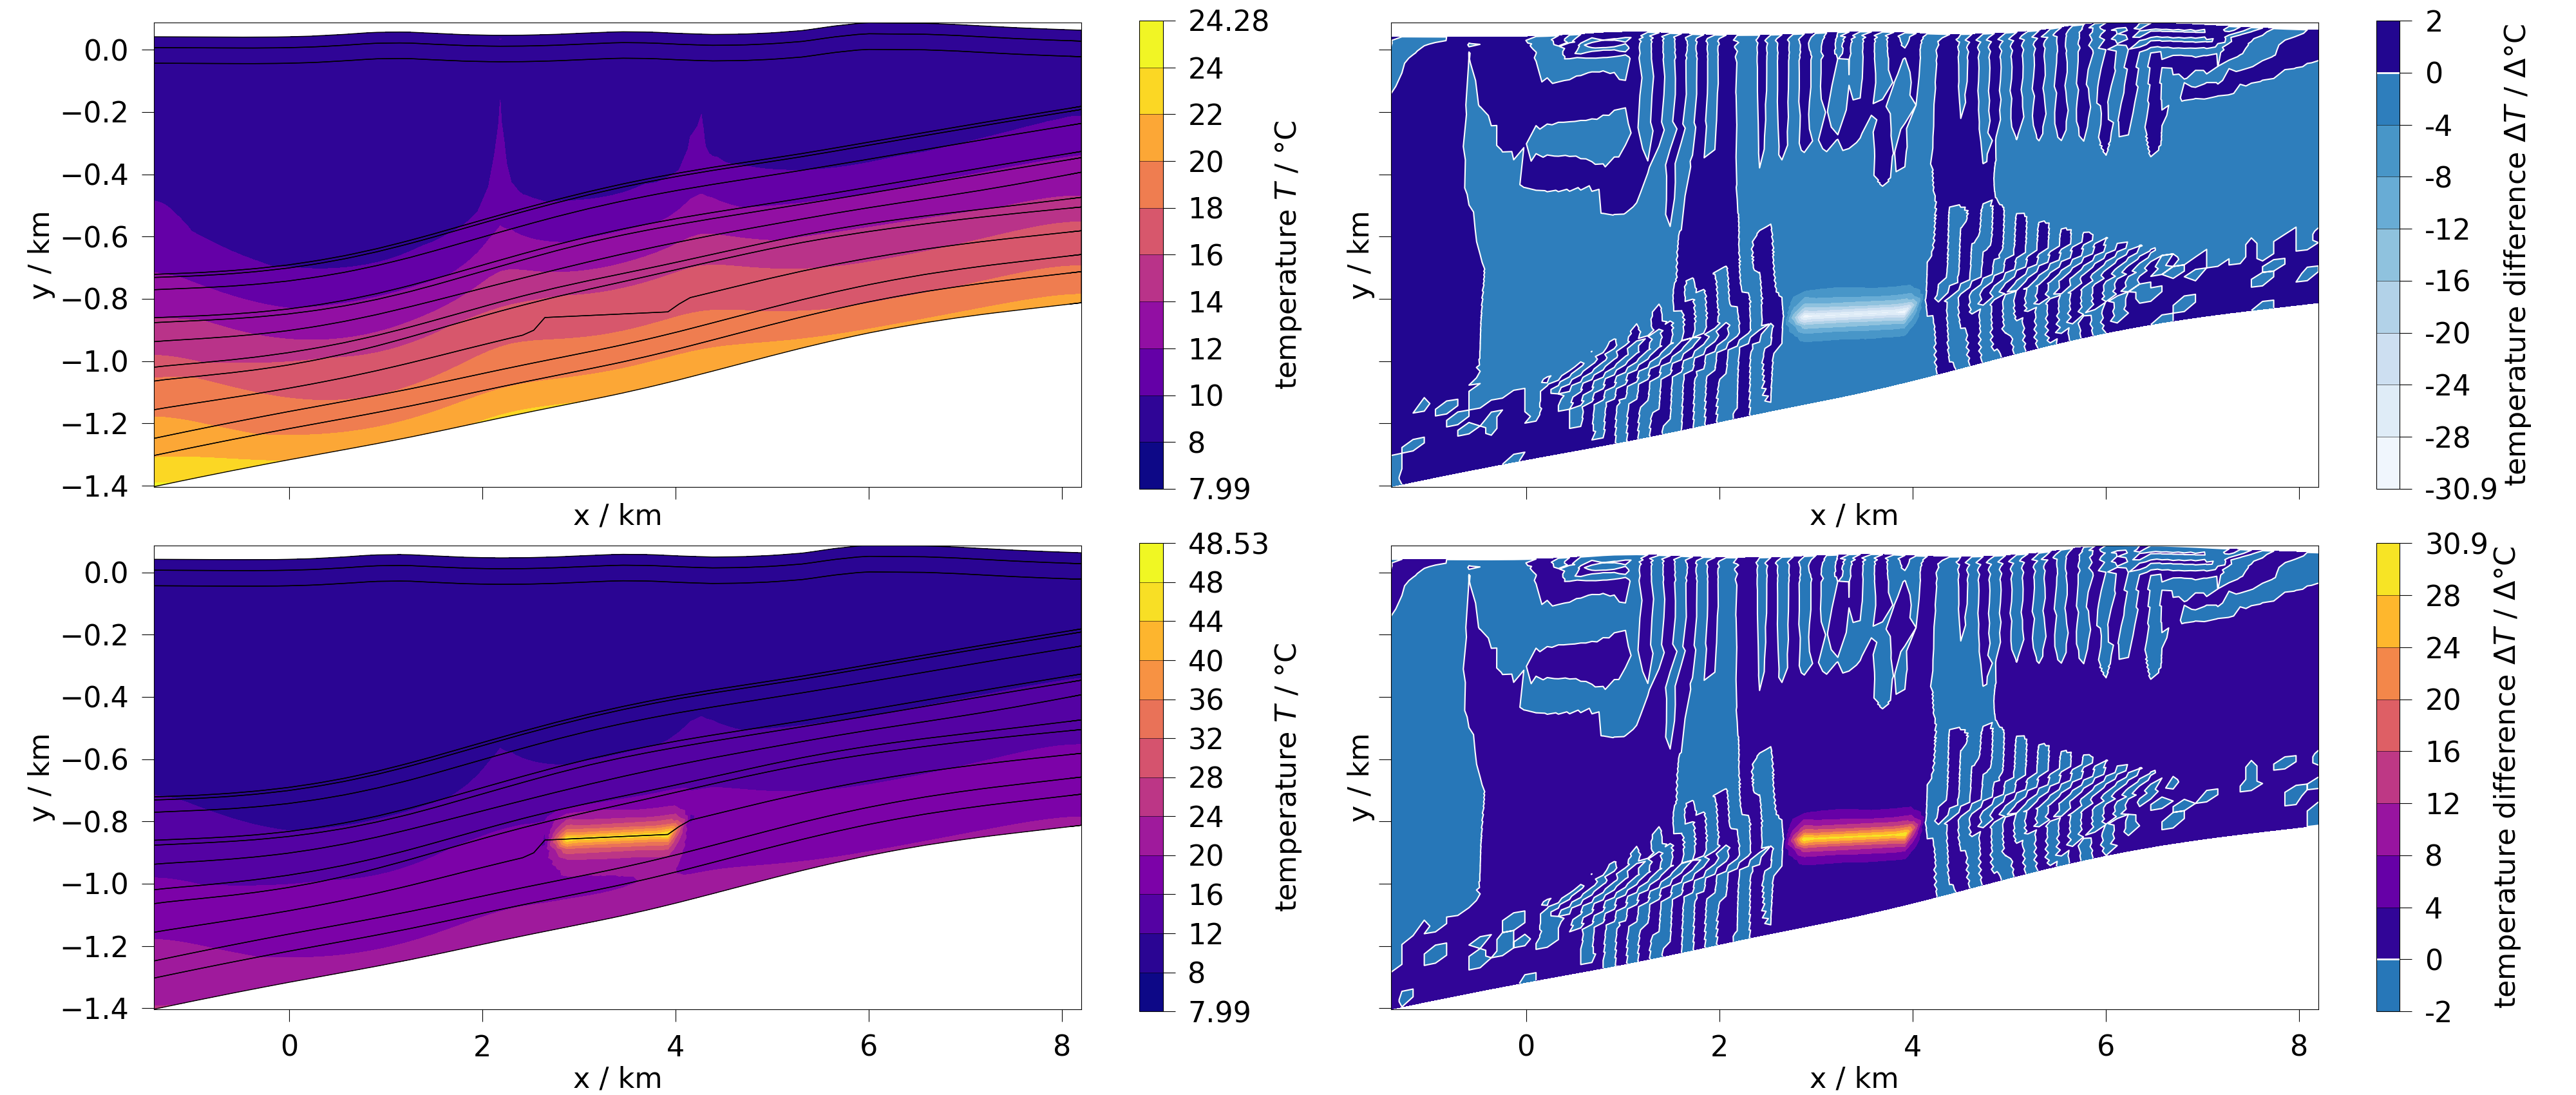
On user defined figure and axis the axis belonging to specific subplot has to be passed.
fig, axs = plt.subplots(2, 2, figsize=(40, 17), sharex=True, sharey=True)
diff_a = ot.mesh.difference(mesh_0, mesh_1, temperature)
diff_b = ot.mesh.difference(mesh_1, mesh_0, temperature)
ot.plot.contourf(mesh_0, temperature, fig=fig, ax=axs[0][0])
ot.plot.contourf(mesh_1, temperature, fig=fig, ax=axs[1][0])
ot.plot.contourf(diff_a, temperature, fig=fig, ax=axs[0][1])
ot.plot.contourf(diff_b, temperature, fig=fig, ax=axs[1][1])
fig.tight_layout()
Total running time of the script: (0 minutes 2.161 seconds)