

Plotting the data#
The following jupyter notebooks provide some examples of how to use ogstools to create all different kinds of plots.
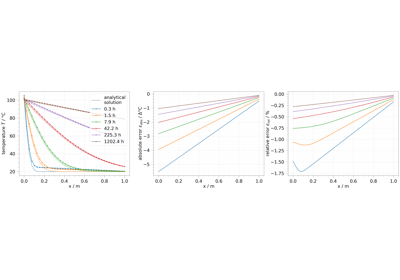
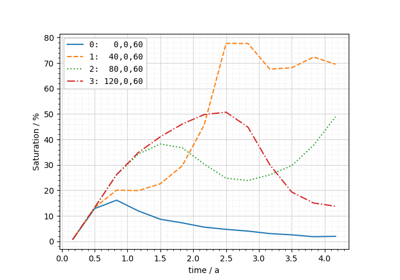
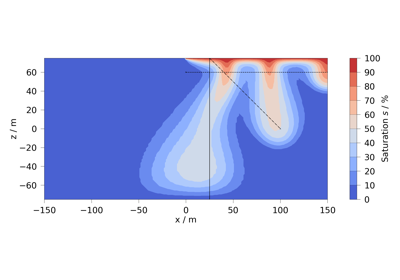
How to compare results with reference data or an analytical solution
How to compare results with reference data or an analytical solution
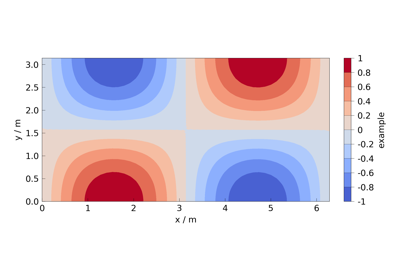
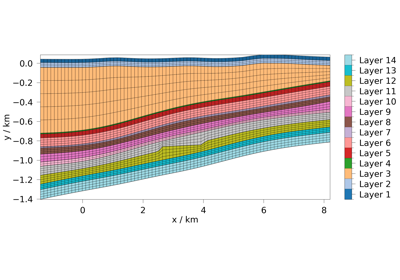


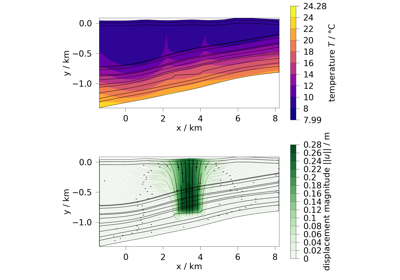
Plotting different process variables on already existing Matplotlib figures / axes
Plotting different process variables on already existing Matplotlib figures / axes