

Note
Go to the end to download the full example code or to run this example in your browser via Binder.
Creating meshes from vtu surface files#
For this example we create meshes from surface layers.
from shutil import which

import ogstools as ot
from ogstools.examples import surface_paths
from ogstools.mesh import create
The loaded surfaces are defined within VTU files and adhere to properties such as non-intersecting boundaries with consistent x and y bounds. Alternatively, surfaces can also be created using PyVista with the same properties.
surface1 = create.Surface(surface_paths[0], material_id=0)
surface2 = create.Surface(surface_paths[1], material_id=5)
surface3 = create.Surface(surface_paths[2], material_id=2)
surface4 = create.Surface(surface_paths[3], material_id=3)
Create 3 layers from previously defined surfaces and add all layers to a layerset (ordererd from top to bottom)
layer1 = create.Layer(top=surface1, bottom=surface2, num_subdivisions=2)
layer2 = create.Layer(top=surface2, bottom=surface3, num_subdivisions=1)
layer3 = create.Layer(top=surface3, bottom=surface4, num_subdivisions=0)

layer_set1 = create.LayerSet(layers=[layer1, layer2, layer3])
From layerset creation of simplified meshes (sm), prism meshes (pm), voxel meshes (vm), tetrahedron mesh (tm) is possible.
sm = layer_set1.to_region_simplified(xy_resolution=200, rank=3).mesh
pm = layer_set1.to_region_prism(resolution=200).mesh
vm = layer_set1.to_region_voxel(resolution=[200, 200, 50]).mesh
# an optional requirement (needs to be installed on system or via pip)
tetgen_present = which("tetgen") is not None
if tetgen_present:
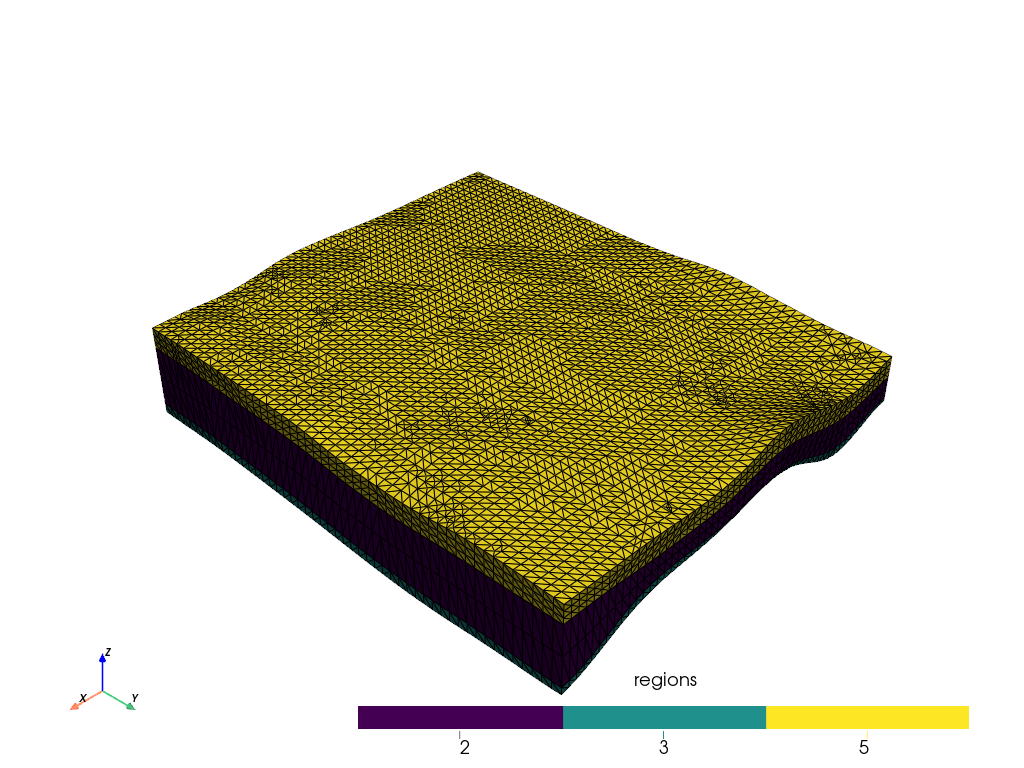
tm = layer_set1.to_region_tetrahedron(resolution=200).mesh
else:
tm = None
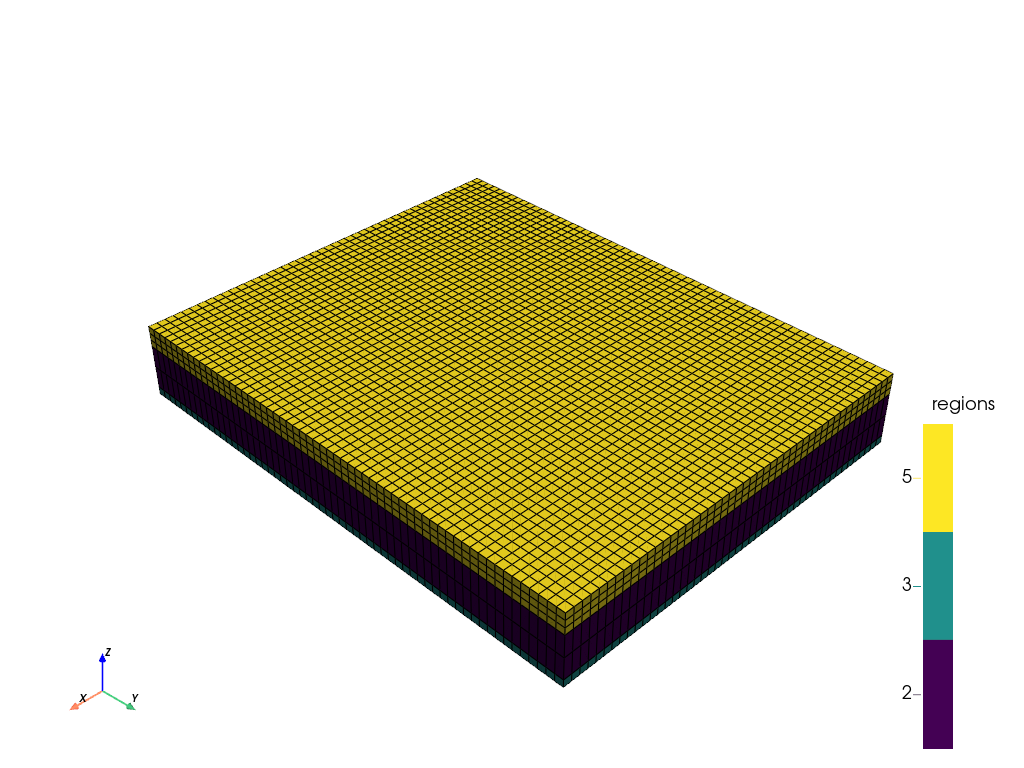
Simplified mesh#
ot.plot.contourf_pv(sm.scale([1, 1, 5]), ot.variables.material_id).show()
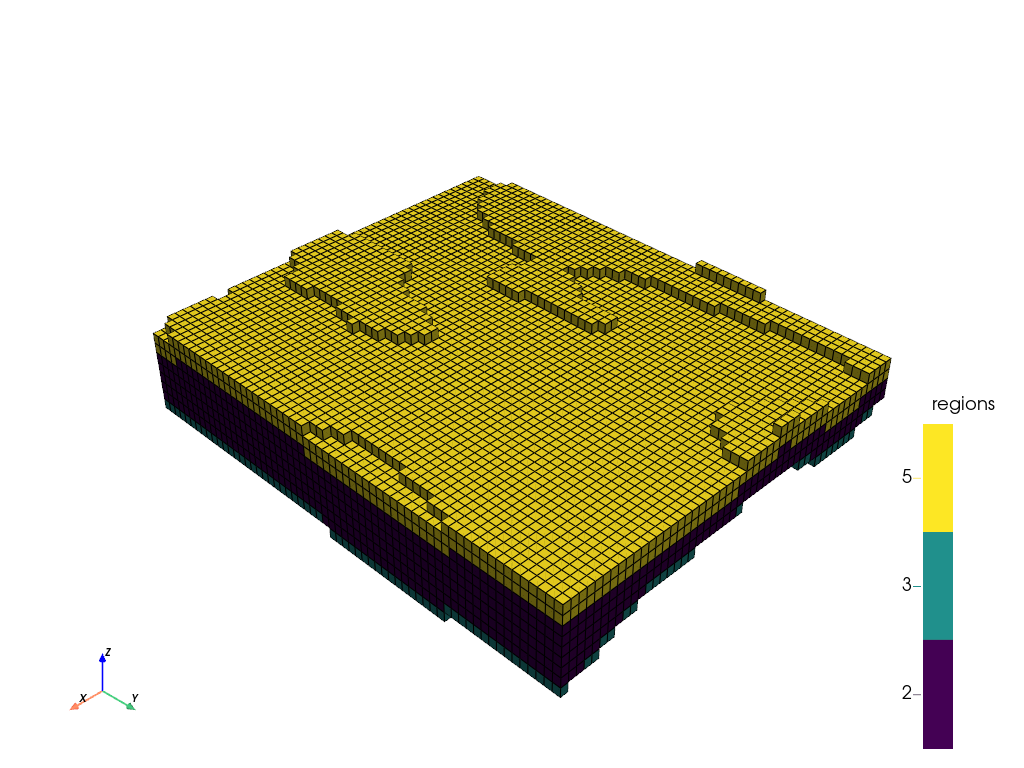
Voxel mesh#
ot.plot.contourf_pv(vm.scale([1, 1, 5]), ot.variables.material_id).show()
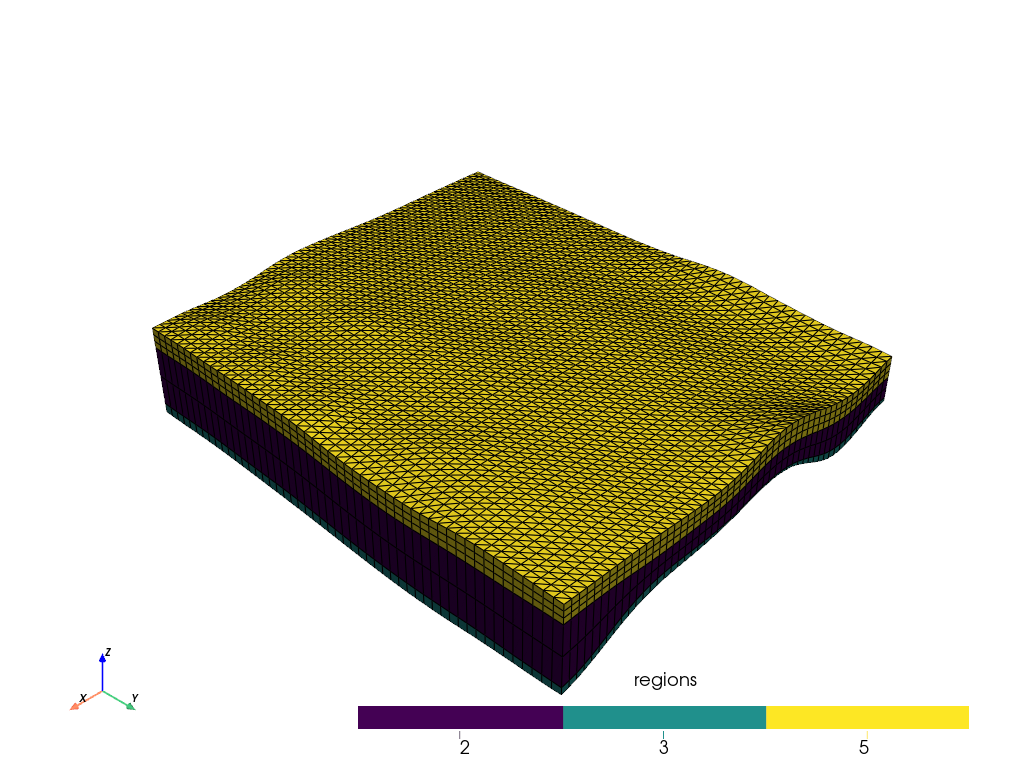
Prism mesh#
ot.plot.contourf_pv(pm.scale([1, 1, 5]), ot.variables.material_id).show()
Tetraeder mesh#
Total running time of the script: (0 minutes 3.609 seconds)