

Note
Go to the end to download the full example code or to run this example in your browser via Binder.
Aggregation of Meshseries Data#
In this example we show how to aggregate data in a model over all timesteps as well as plot differences between to timesteps. For this purpose we use a component transport example from the ogs benchmark gallery (https://www.opengeosys.org/stable/docs/benchmarks/hydro-component/elder_jupyter/).
To see this benchmark results over all timesteps have a look at How to create Animations.
import numpy as np

import ogstools as ot
from ogstools import examples

mesh_series = examples.load_meshseries_CT_2D_XDMF().scale(time="a")
saturation = ot.variables.saturation
To read your own data as a mesh series you can do:
from ogstools.meshlib import MeshSeries
mesh_series = MeshSeries("filepath/filename_pvd_or_xdmf")
You can also use a variable from the available presets instead of needing to create your own: Variable presets and data transformation
You aggregate the data in MeshSeries over all timesteps given some
aggregation function, e.g. np.min, np.max, np.var
(see: aggregate_temporal()).
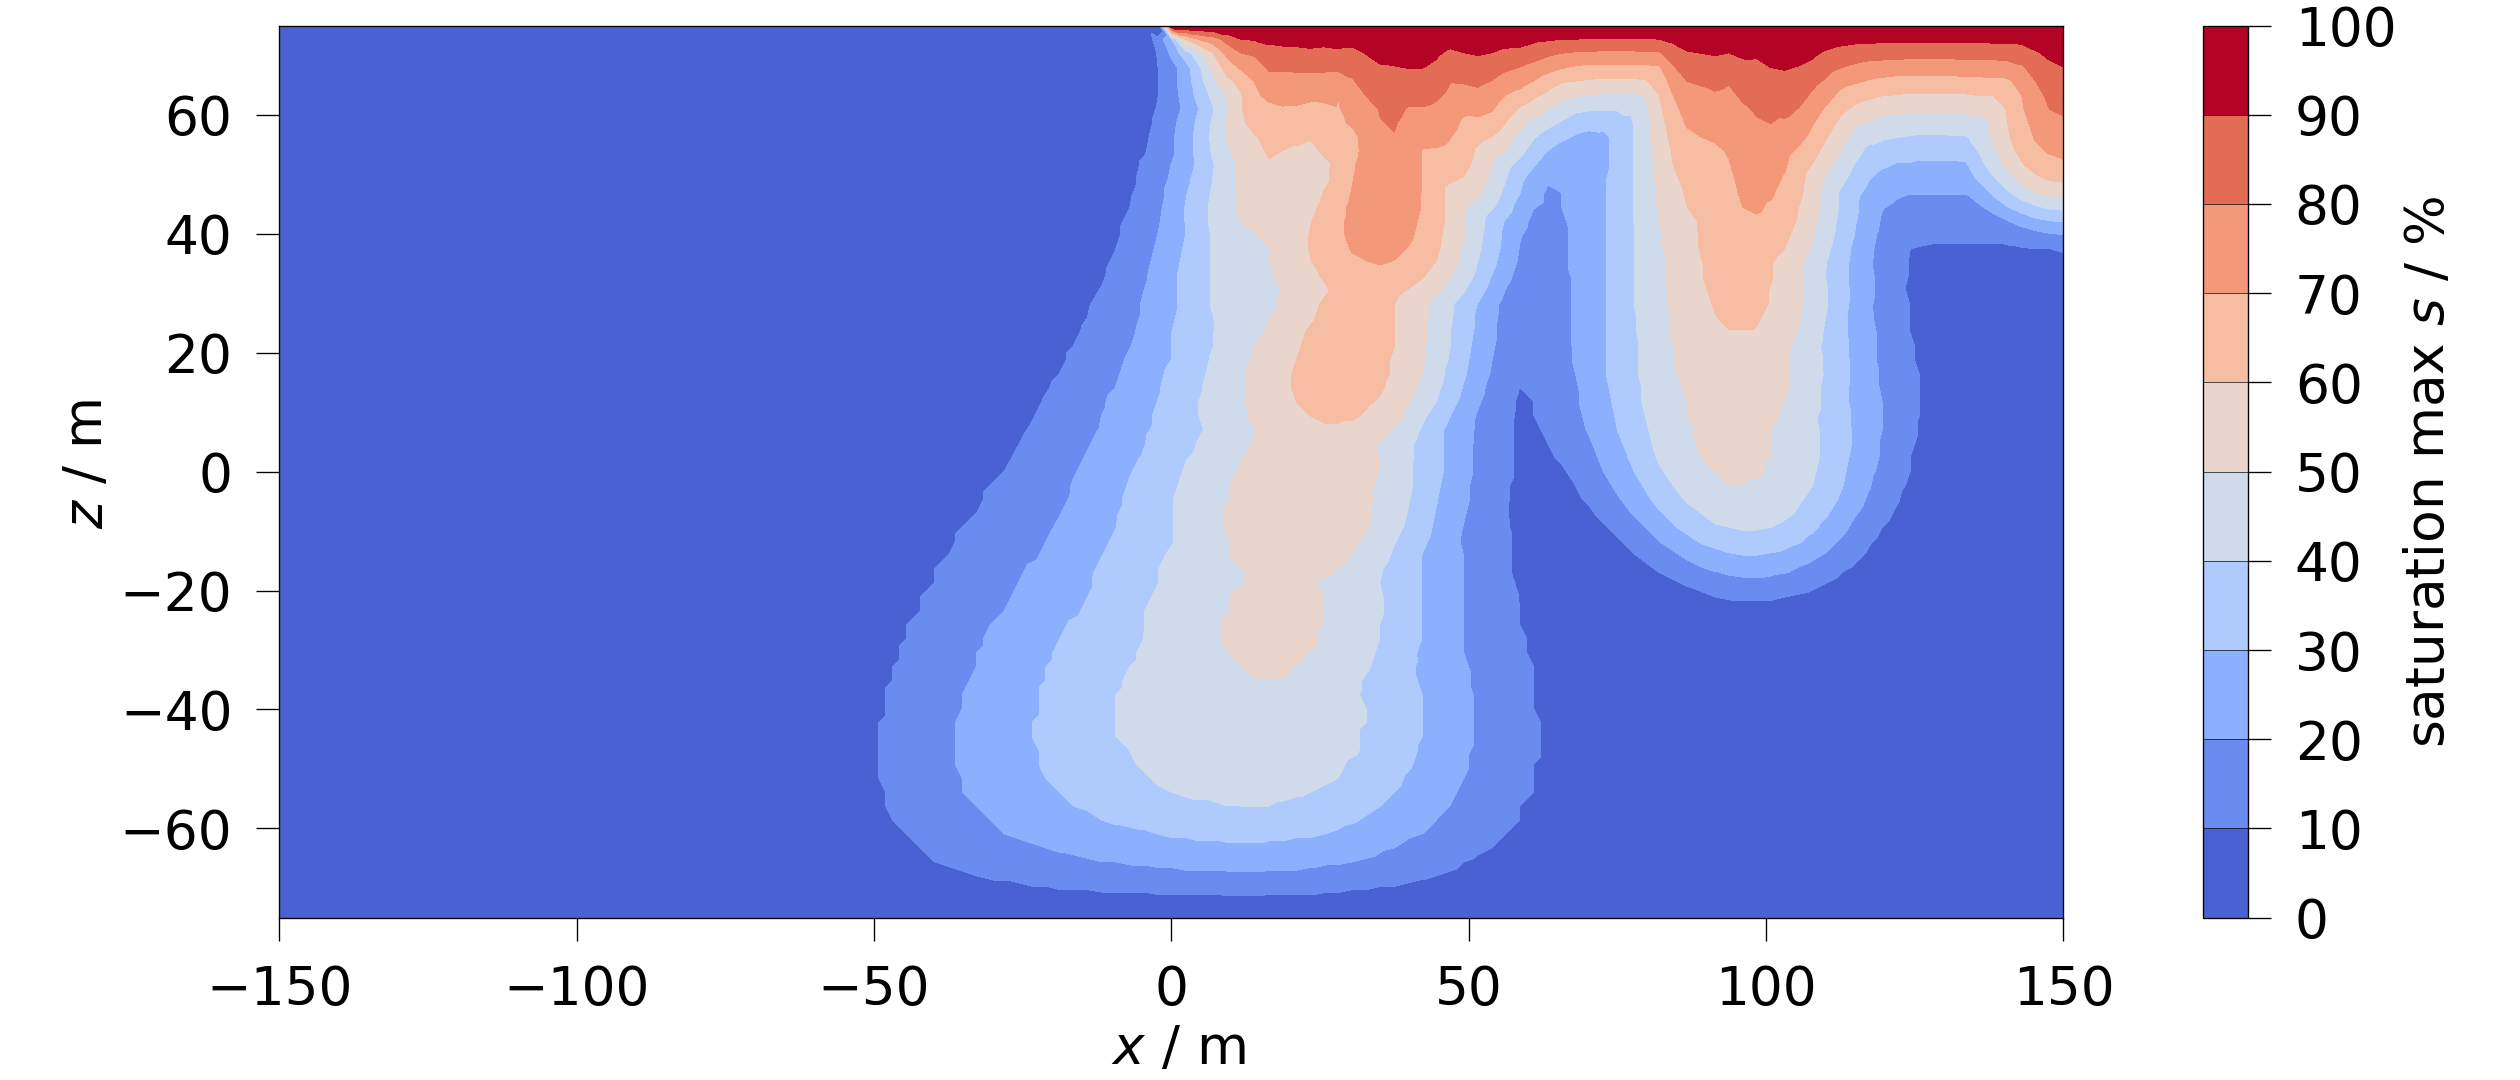
The following code gets the maximum saturation for each point in the mesh over
all timesteps and plots it. Note: the data in the returned mesh has a suffix
equal to the aggregation functions name. The plot function will find the
correct data anyway if given the original variable
Due to numerical oscillations, this dataset contains a few cells with
slightly unphysical saturation (below 0% or above 100%). We clip the
colorbar at vmin=0, vmax=100 to avoid these values dominating the
plotted range.
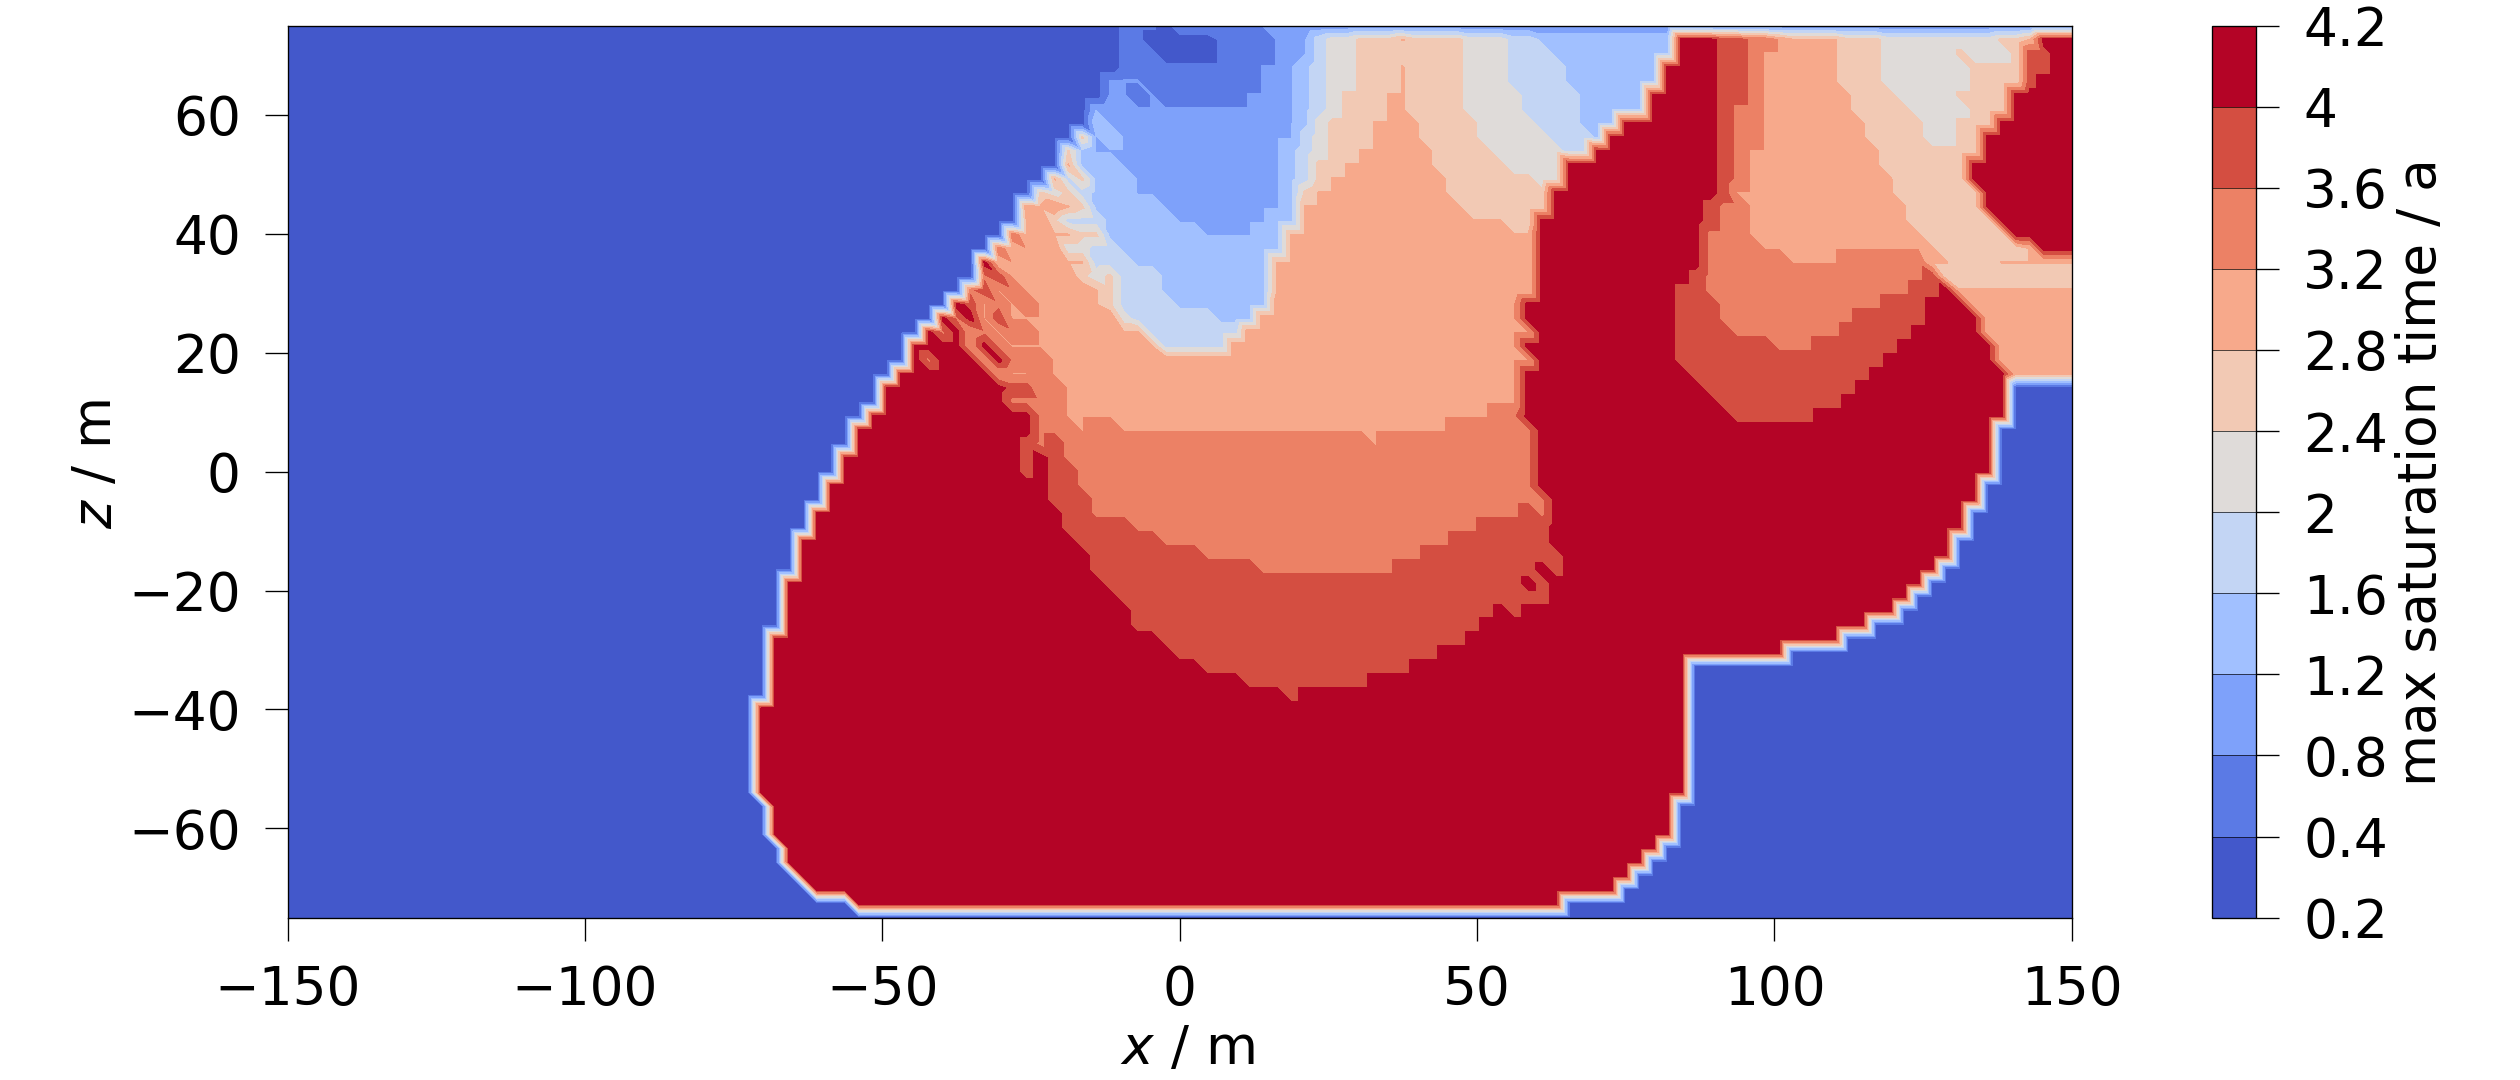
It is also possible to plot the time when the minimum or maximum occurs. However, here we have to use a new variable for the plot to handle the units correctly:
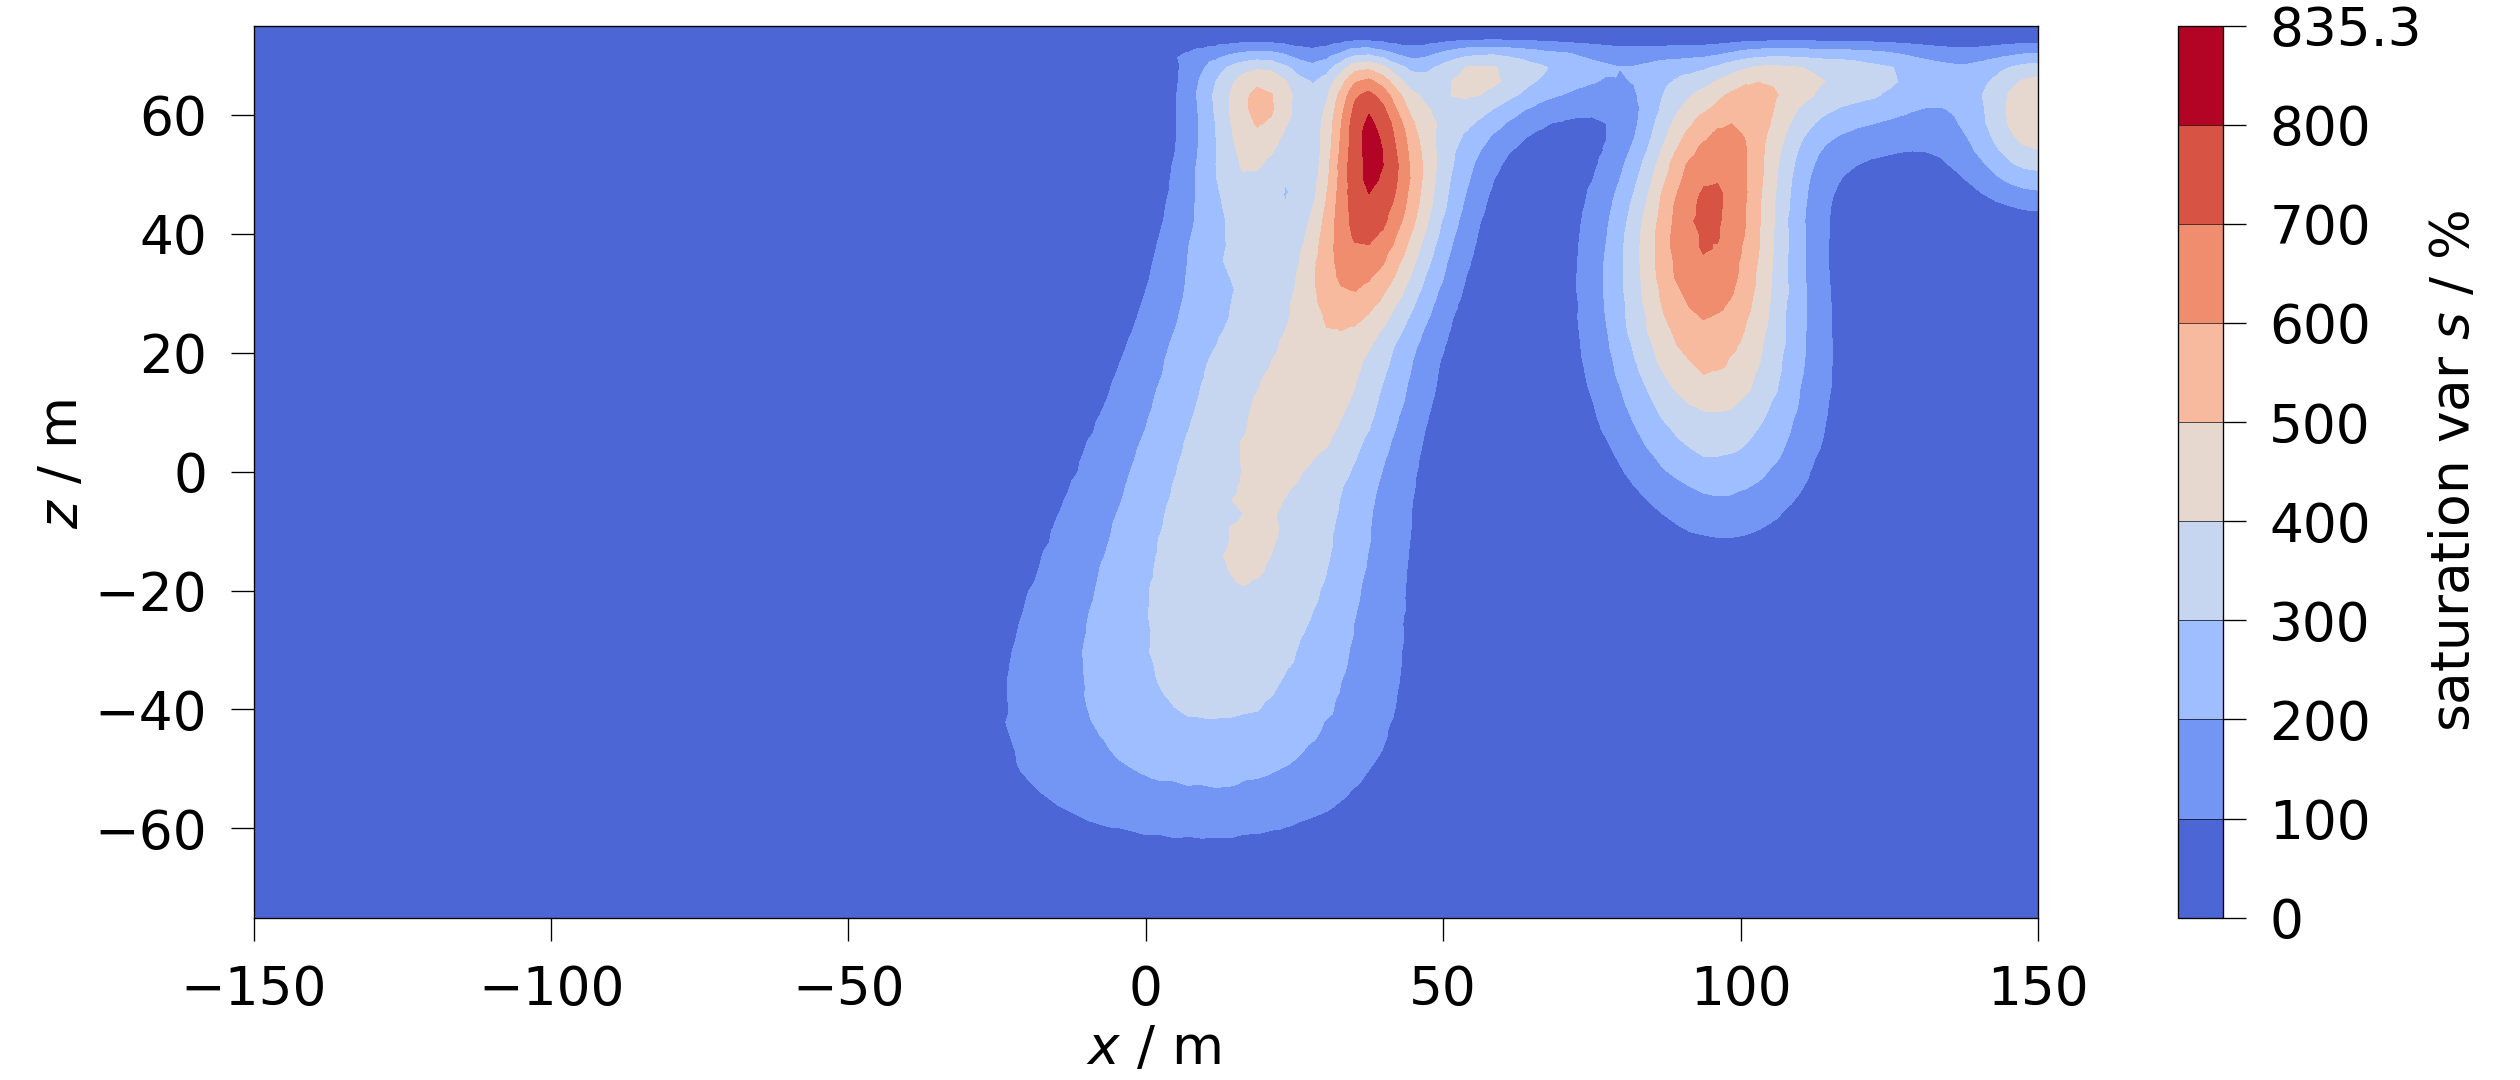
Likewise we can calculate and visualize the variance of the saturation:
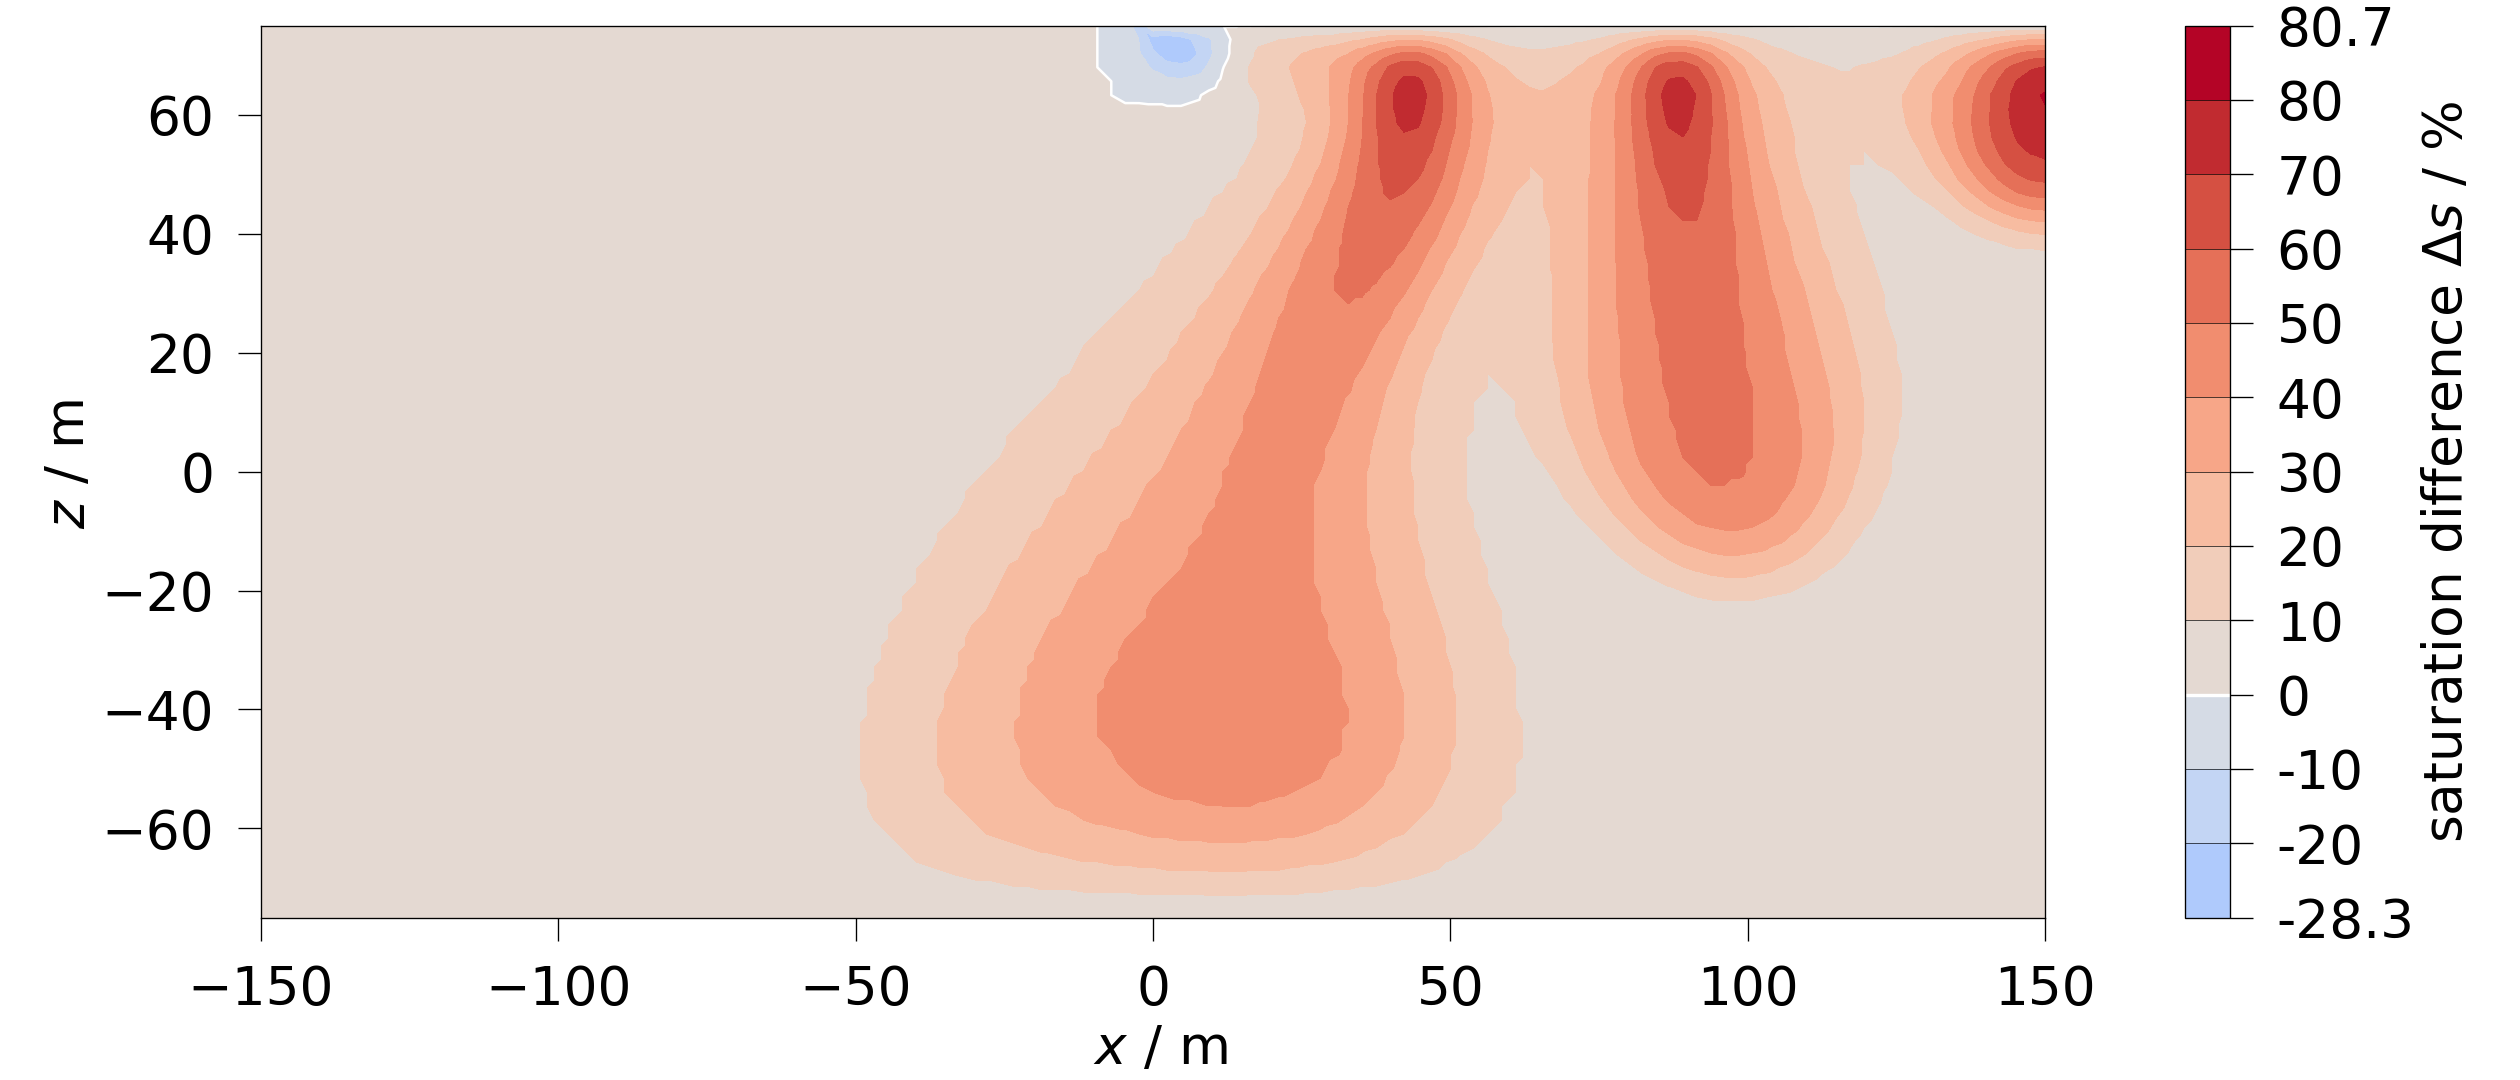
Difference between the last and the first timestep:
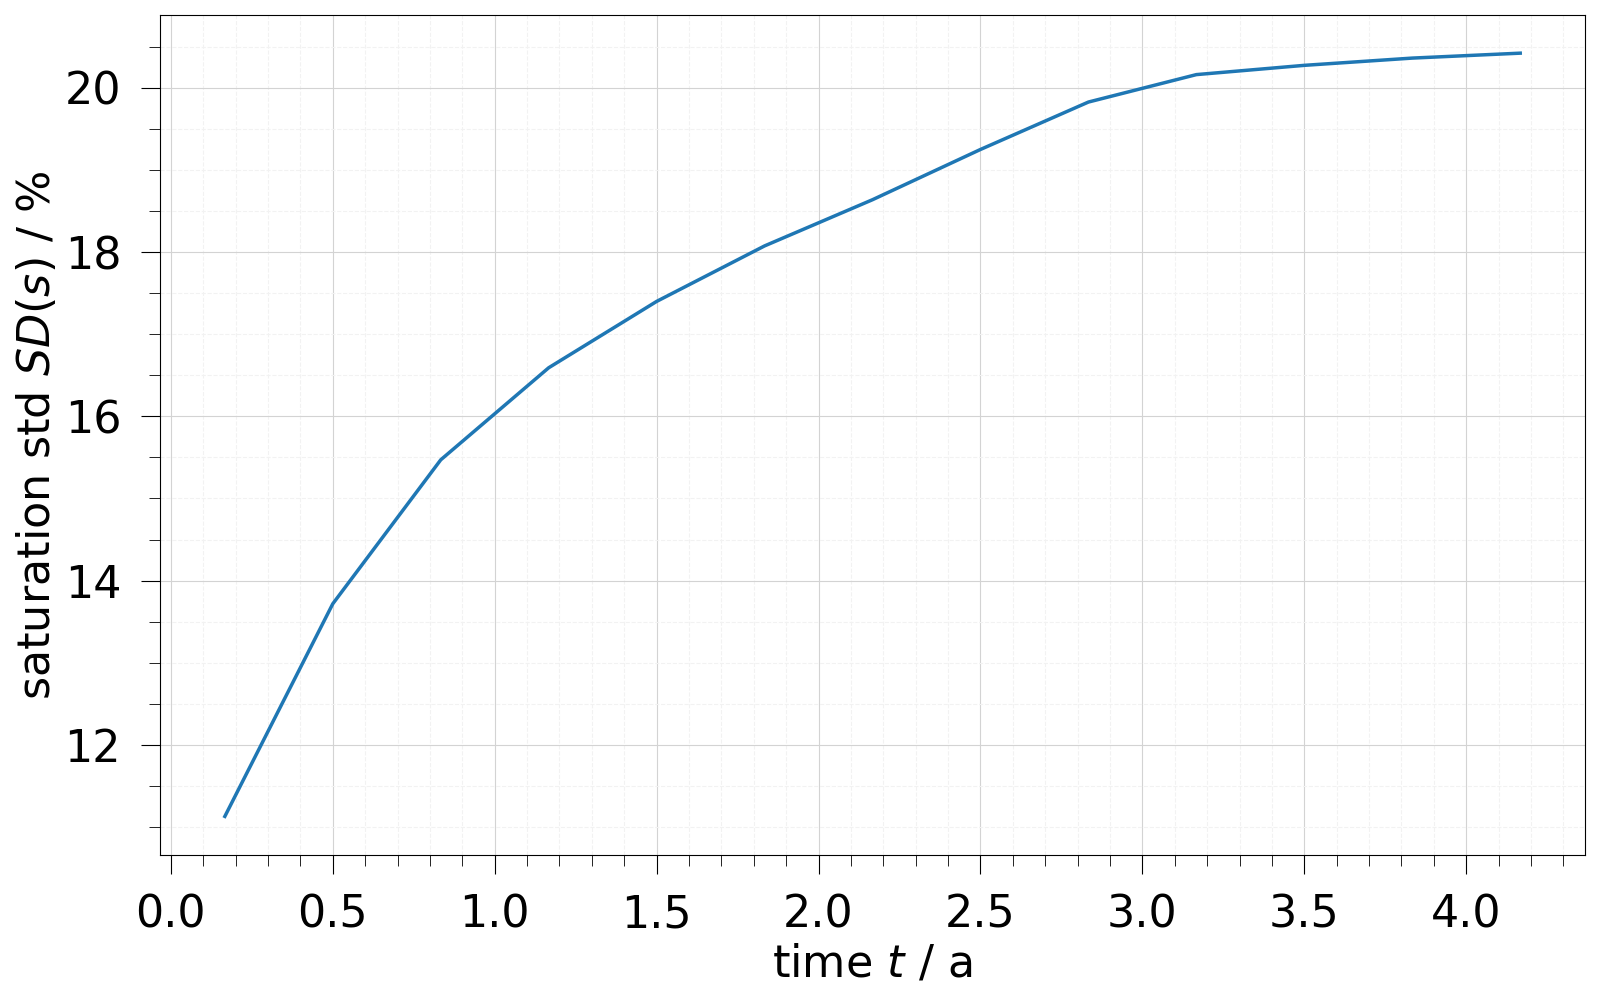
It’s also possible to aggregate the data per timestep to return a timeseries of e.g. the max or mean value of a variable in the entire domain.
mean_satuarion_array = mesh_series.aggregate_spatial(saturation, np.mean)
Instead of calculating the array itself, you can also plot it directly by
using methods of the Variable which correspond to the equally named
numpy-functions. The following are available:
min, max, mean, median, sum, std, var.
fig = mesh_series.plot_line(saturation.std)
fig.tight_layout()
fig.show()
Total running time of the script: (0 minutes 3.038 seconds)
